A Very Small Slice of Pi


image Rhubarb pie (Source: Wikipedia)


Some people know a suspiciously large number of the digits of pi. Perhaps you have met one of these people. They can typically be found hiding behind bushes and under the counters at pastry shops, just... waiting. At the slightest hint of a mention of pi, they will jump out and start reciting the digits like there's a prize at the end. After rattling off numbers for a few minutes they abruptly come to an end, grin like an idiot, and walk away. It is an unpleasant encounter. The sheer uselessness of this kind of thing has always bothered me, so I'd like to set a preliminary upper bound on the number of digits of pi that could ever possibly potentially kind of be useful (maybe). For those following along at home, now would be a good time to put on your numerology hats. Alright, so I hear this thing pi is fairly useful when dealing with circles. Let's say we want to make a really big circle and have its diameter only deviate by a very small amount from the correct value. To do this successfully, we will have to know pi fairly well. Let's take this to extremes now. Suppose I want to put a circle around the entire visible universe such that the uncertainty in the diameter is the size of a single proton. What would be the fractional uncertainty in the circumference in this case? If we know pi exactly, then we have that $$\delta C = \frac{\partial C}{\partial d} \delta d = \pi \delta d = C \frac{\delta d}{d}, $$ where d is the diameter and C is the circumference. In other words, the fractional uncertainty in the circumference is just $$\frac{\delta C}{C} = \frac{\delta d}{d}. $$ Using a femtometer for the size of a proton and 90 billion light years for the size of the Universe [1], we get $$\frac{\delta C}{C} = \frac{\delta d}{d} = \frac{10^{-15}\mbox{m}}{(90\times10^9)(3\times10^7\mbox{s})(3\times10^8\mbox{m s}^{-1})} \sim\frac{10^{-15}}{10^{27}}\sim10^{-42}.$$ Alright, so how well do we need to know pi to get a similar fractional uncertainty? Well, we have that $$\frac{\delta \pi}{\pi} = \frac{\delta C}{C} = 10^{-42}, $$ so we can afford an uncertainty in pi of $$ \delta \pi = \pi \times 10^{-42}$$ and thus we'll need to know pi to about 42 digits. How's that for an answer? So if we have a giant circle the size of the entire visible universe, we can find its diameter to within the size of a single proton using pi to 42 digits. Therefore, I adopt this as the maximal number of digits that could ever prove useful in a physical sense (albeit under a somewhat bizzarre set of circumstances). If reciting hundreds of digits is what makes you happy, go for it. But 42 digits is more than enough pi for me.

[1] "But I thought the Universe was only 13.7 billion years! What voodoo is this!?" Yeah, I know. See here for a nice explanation.[back]

Primes in Pi

image

Recently, I've been concerned with the fact that I don't know many large primes. Why? I don't know. This has led to a search for easy to remember prime numbers. I've found a few goods ones, namely

But then I remembered that I already know 50 digits of pi, memorized one boring day in grade school, so this got me wondering whether there were any primes among the digits of pi

Lo an behold, I wrote a little script, and found a few:

Found one, with 1 digits, is: 3 Found one, with 2 digits, is: 31 Found one, with 6 digits, is: 314159 Found a rounded one with 12 digits, is: 314159265359 Found one, with 38 digits, is: 31415926535897932384626433832795028841

I think it's usual for most science geeks to know pi to at least 3.14159, if you're one of those people, now you know a 6 digit prime! for free!

F-91 Revisited


image Farmer Uncle Sam...with a rifle. (Image Credit: Wikipedia)


Today was a sunny exception to the grey overcast rule of weather in Ithaca. I should be overjoyed by this anomaly, spending the day outside flying a kite or playing frisbee with a border collie in a bandanna. Unfortunately, today was also the beginning of Daylight Savings Time (DST) - my least favorite day of the year. For my colleagues unfamiliar with this temporal travesty (I'm looking at you Arizona), let me briefly explain DST. Once a year, the time lords steal a single hour from us and place it in an escrow account for future disbursement, presumably in some elaborate scheme to gain the favor of hat-throwing farmer-clock hybrids (see image left). The details are a bit murky, but the net result is that today I had one less hour to do my very favorite thing in the whole wide world - sleep. It also means that I have to set my watch, so I figured I'd check in and see how well my previous model for time-loss in my watch has held up. About a month ago, I looked at how my watch slowly deviated from the official time (the original post can be found here and a helpful clarification by Tom can be found here). Based on a little over 50 days worth of data, I found that my watch lost about 0.35 seconds per day against the official time. About 50 days have passed since my last measurement and today when I set the watch, so I thought it would be interesting to see how well my model fit the new data. The old data are presented in Figure 1 in blue, the old best fit line is in red, and the new data point (taken this morning) is in green. As always, click through the plot for a larger version.


image Figure 1


The new data point appears to be in fair agreement with the old best-fit model, but it's a little hard to see here. Zooming in a bit, though, we see that the model lies outside the error bar of the new data point.


image Figure 2


So is this a big deal? Not really. But if it will help you sleep at night, we can redo the fitting with the new data point included to see how much things change. The the plots with the updated model to include all data points are provided below with the old data in blue and the new point in green.


image Figure 3


The new model looks a whole lot like the old one, except the best fit line now appears to go through the new data point. Zooming in a little, we see that it does indeed fall within the error bars of our new point.


image Figure 4


Alright, so the new model fits with our new point, but how much did the model have to change? Well, the fit to just the old data gave an offset of 0.36 seconds and a loss rate of 0.35 seconds per day. The new model has an offset of 0.40 seconds and a loss rate of 0.348 seconds per day. Overall, not a significant change. It looks as though I may continue to not worry about the accuracy of my watch. I have set it to match the official time and have no intention of fiddling with it until I have to set it again at the end of Daylight Savings Time - my favorite day of the year.

Proofiness: A look into how mathematics relates to American political life

Dearest readers, This is my first post on The Virtuosi, so I thought I’d take a moment to introduce myself. I’m a first year physics graduate student at Cornell, recently joined after 2 years working as an engineer first at a private firm and then at a national lab. I myself have had lots of fun following the exploits of my estimable colleagues here on The Virtuosi, and I thought I could bring a new angle to the content here. I would like to use this space to discuss how science interacts with everyday life in a cultural sense. How does science appear in popular culture? How do political or social issues relate back to science? Those sorts of questions. (I understand that there are plenty of other resources elsewhere that offer far more intelligent insight into these matters than I can, but in the very least this will give people a chance point them out to me as they yell at me in the forum below.) Enough intro, here begins my very first blog post: Being interested in how science is communicated to the public, I am an avid reader of popular science. While academic types sometimes dismiss this kind of writing as shallow or otherwise uninteresting, I think science writers perform a very important function serving as a way to convey information about conceptually challenging topics to a general audience. At their best, I find that these books serve as examples for how I can communicate my own ideas better, and in addition challenge my understanding of how science relates back to society in general. This being said, I cannot recommend Charles Seife’s Proofiness enough. The basic premise of this book is to explore the way that good mathematics is hijacked, twisted, or ignored in everyday life, and the ugly consequences of the tendency to misunderstand numbers and measurements. Seife gives a number of fascinating examples of the ways in which numbers and math connect to American democracy. American government functions through representation, and so the “enumeration” of citizens and their opinions through the Census and elections is an essential part of the democratic process. This “enumeration” is a counting measurement, subject to errors like any other. And yet, the laws that govern how Censuses and elections are run ignore this fact. Seife’s discussion of elections (and in particular Bush v. Gore) is fascinating, but I won’t spoil that here. Here’s my take on the discussion of the Census that appears in Proofiness: Consider a (vague) physics experiment. I want to know how many particles are inside a box. To figure this out, I have a detector that goes ping every time a particle passes through it. I set up my detector inside the box and count the number of times that it goes ping in a certain amount of time. I can then use that count to guess at the number of particles that I have in my box. My measurement will let me estimate N to within some margin of error. This process is perhaps unnecessary if I have only five particles in my box (in which case, I might just open the box and count what I see inside), but if I have 300 million particles in my box, it would be totally impractical for me to reach into the box 300 million times and count each one individually. We can consider the Census to be just like this physics experiment. I have N inhabitants (particles) living in my country (box), and I can use my detector (census replies) to count a certain number of people. In principle, using well-understood statistical techniques of regression and error analysis, I can estimate to within a very good margin of error how many people live in each region of the country. Instead, what the Census requires is that we reach inside the box (send representatives to every household that doesn’t reply by mail) and count every single person. The whole process ignores the fact that even if we send a representative to every single household there will still be some margin of error in our counting measurements. No such measurement can be made without errors. The consequences of ignoring these errors, says Seife, can be that we waste money in attempting the impossible and trying to count everybody. From a civic-minded perspective, this attitude towards the perfection of the Census can backfire. For example, if undercounting occurs (i.e., certain households do not respond for some reason), the Census has no mechanism for correcting that miscount. Counter-intuitively, the Census laws actually prohibit the use of any statistical techniques to correct miscounting. The result is that those slow to respond are ignored and not taken into account when allotting seats in the legislature to represent them. Proofiness is a fascinating book and a fun read, and I recommend you all look it up. In addition, it serves as an excellent example of science writing that helped me to rethink how scientific ideas relate to everyday life. I hope to invite consideration of these topics here and in future posts. If you want to know more about the inspiration for this post, go here.

Time Keeps On Slippin'


image This is picture of a watch. (Source: Wikipedia)


A couple of months ago, the Virtuosi Action Team (VAT) assembled for lunch and the discussion quickly and unexpectedly turned to watches. As Nic and Alemi argued over the finer parts of fancy-dancy watch ownership, I looked down at my watch: the lowly Casio F-91W. Though it certainly isn't fancy, it is inexpensive, durable, and could potentially win me an all-expense paid trip to the Caribbean. But how good of a watch is it? To find out, I decided to time it against the official U.S. time for a couple of months. Incidentally, about half-way in I found out that Chad over at Uncertain Principles had done essentially the same thing already. No matter, science is still fun even if you aren't the first person to do it. So here's my "new-to-me" analysis. Alright, so how do we go about quantifying how "good" a watch is? Well, there seem to be two main things we can test. The first of these is accuracy. That is, how close does this watch come to the actual time (according to some time system)? If the official time is 3:00 pm and my watch claims it is 5:00 am, then it is not very accurate. The second measure of "good-ness" is precision or, in watch parlance, stability. This is essentially a measure of the consistency of the watch. If I have a watch that is consistently off by 5 minutes from the official time, then it is not accurate but it is still stable. In essence, a very consistent watch would be just as good as an accurate one, because we can always just subtract off the known offset. To test any of the above measures of how "good" my cheap watch is, we will need to know the actual time. We will adopt the official U.S. time as provided on the NIST website. This time is determined and maintained by a collection of really impressive atomic clocks. One of these is in Colorado and the other is secretly guarded by an ever-vigilant Time Lord (see Figure 1).


image Figure 1: Flavor Flav, Keeper of the Time


At 9:00:00 am EST on November 30th, I synchronized my watch with the time displayed on the NIST website. For the next 54 days, I kept track of the difference between my watch an the NIST time. On the 55th day, I forgot to check the time and the experiment promptly ended. The results are plotted below in Figure 2 (and, as with all plots, click through for a larger version).


image Figure 2: Best-fit to time difference


As you can see from Figure 2, the amount of time the watch lost over the timing period appears to be fairly linear. There does appear to be a jagged-ness to the data, though. This is mainly caused by the fact that both the watch and the NIST website only report times to the nearest second. As a result, the finest time resolution I was willing to report was about half a second. Adopting an uncertainty of half a second, I did a least-squares fit of a straight line to the data and found that the watch loses about 0.35 seconds per day. As far as accuracy goes, that's not bad! No matter what, I'll have to set my watch at least twice a year to appease the Daylight Savings Gods. The longest stretch between resetting is about 8 months. If I synchronize my watch with the NIST time to "spring forward" in March, it will only lose about $$ t_{loss} = 8\~\mbox{months} \times 30\frac{\mbox{days}}{\mbox{month}} \times 0.35 \frac{\mbox{sec}}{\mbox{day}} = 84\~\mbox{sec} $$ before I have to re-synchronize to "fall back" in November. Assuming the loss rate is constant, I'll never be more than about a minute and a half off the "actual" time. That's good enough for me. Furthermore, if the watch is consistently losing 0.35 seconds per day and I know how long ago I last synchronized, I can always correct for the offset. In this case, I can always know the official time to within a second (assuming I can add). But is the watch consistent? That's a good question. The simplest means of finding the stability of the watch would be to look at the timing residuals between the data and the model. That is, we will consider how "off" each point is from our constant rate-loss model. A plot of the results is shown below in Figure 3.


image Figure 3: Timing residuals


From Figure 3, we see that the data fit the model pretty well. There's a little bit of a wiggle going on there and we see some strong short-term correlations (the latter is an artifact of the fact that I could only get times to the nearest second). To get some sense of the timing stability from the residuals, we can calculate the standard deviation, which will give us a figure for how "off" the data typically are from the model. The standard deviation of the residuals is $$ \sigma_{res} = 0.19\~\mbox{sec}. $$ A good guess at the fractional stability of the watch would then just be the standard deviation divided by the sampling interval, $$ \frac{\sigma_{res}}{T} = 0.19\~\mbox{sec} \times \frac{1}{1\~\mbox{day}} \times \frac{1\~\mbox{day}}{24\times3600\~\mbox{sec}} \approx 2\times10^{-6}.$$ In words, this means that each "tick" of the watch is consistent with the average "tick" value to about 2 parts in a million. That's nice...but isn't there something fancier we could be doing? Well, I have been wanting to learn about Allan variance for some time now, so let's try that. The Allan variance (refs: original paper and a review) can be used to find the fractional frequency stability of an oscillator over a wide range of time scales. Roughly speaking, the Allan variance tells us how averaging our residuals over different chunks of time affects the stability of our data. The square root of the Allan variance, essentially the "Allan standard deviation," is plotted against various averaging times for our data below in Figure 4.


image Figure 4: Allan variance of our residuals


From Figure 4, we see that as we increase the averaging time from one day to ten days, the Allan deviation decreases. That is, the averaging reduces the amount of variation in the frequency of the data, making it more stable. However, at around 10 days of averaging time it seems as though we hit a floor in how low we can go. Since the error bars get really big here, this may not be a real effect. If it is real, though, this would be indicative of some low-frequency noise in our oscillator. For those who prefer colors, this would be "red" noise. Since the Allan deviation gives the fractional frequency stability of the oscillator, we have that $$\sigma_A = \frac{\delta f}{f} = \frac{\delta(1/t)}{1/t} = \frac{\delta t}{t}. $$ Looking at the plot, we see that with an averaging time of one day, the fractional time stability of the watch is $$\frac{\delta t}{t} \approx 2\times10^{-6}, $$ which corresponds nicely to our previously calculated value. If we average over chunks that are ten days long instead, we get a fractional stability of $$\frac{\delta t}{t} \approx 10^{-7}, $$ which would correspond to a deviation from our model of about 0.008 seconds. Not bad. The initial question that started this whole ordeal was "How good is my watch?" and I think we can safely answer that with "as good as I'll ever need it to be." Hooray for cheap and effective electronics!

The Stars Fell on Abe and Frederick


image The 1833 Leonids (Source: Wikipedia)


Word on the street is there's a meteor shower set for late Tuesday night, peaking at 2 am EST on January 4th [1]. The meteors in question are the Quadrantids, which often go unnoticed for two good reasons. Reason the first: apparently [2], they are usually pretty awful. Unlike the "good" meteor showers, the Quadrantids are bright and pretty for only a few hours (instead of a few days). This means that a lot of the time, we just miss them. Reason the second: they have a lame name [3]. But this year, they should be pretty good if the weather is right. Now, there's lots of neat physics to talk about with meteors, but that's not why I bring it up. This has all just been flimsy pretext so I could share a historical anecdote about a meteor shower. Trickery, indeed. Those who feel cheated are free to leave now with heads held high. Those still around (Hi, Mom!) will hear about the night in 1833 when the stars fell on Alabama (and the rest of the country, too). The Leonids typically put on a pretty good show, but their showing in 1833 was so dramatic that the term "meteor shower" was coined to describe what was happening. The 1833 Leonids were truly one for the ages and made such an impression that people were often able to remember when events happened by their relation to the night when "the stars fell." It was in this use as a "calendar anchor" that I first heard of this particular meteor shower. While home for the holiday I was reading Life and Times of Frederick Douglass, one of the later autobiographies written by the former slave and noted abolitionist. Recounting when he was moved from Baltimore to a plantation on the Eastern Shore of Maryland, Douglass writes:

I went to St. Michaels to live in March, 1833. I know the year, because it was the one succeeding the first cholera in Baltimore, and was also the year of that strange phenomenon when the heavens seemed about to part with their starry train. I witnessed this gorgeous spectacle, and was awe-struck. The air seemed filled with bright descending messengers from the sky. It was about daybreak when I saw this sublime scene. I was not without the suggestion, at the moment, that it might be the harbinger of the coming of the Son of Man; and in my then state of mind I was prepared to hail Him as my friend and deliverer. I had read that the "stars shall fall from heaven," and they were now falling. I was suffering very much in my mind. It did seem that every time the young tendrils of my affection became attached they were rudely broken by some unnatural outside power; and I was looking away to heaven for the rest denied me on earth.

Douglass wrote these words almost 50 years after the fact and it is evident that the meteor shower clearly had an effect on him. By this time (at age 15), Douglass had already made up his mind to escape from slavery. Three years later, he made a failed attempt. Two years after that, in 1838, Frederick Douglass escaped to the North and became an influential abolitionist. After reading the above passage from Douglass, I wondered who else may have seen the 1833 Leonids. After a bit of research, I found a paper by Olson & Jasinski (1999) which provides an excerpt from Walt Whitman recounting a story told by Abraham Lincoln. Whitman writes:

In the gloomiest period of the war, he [Lincoln] had a call from a large delegation of bank presidents. In the talk after business was settled, one of the big Dons asked Mr. Lincoln if his confidence in the permanency of the Union was not beginning to be shaken — whereupon the homely President told a little story. “When I was a young man in Illinois,” said he, “I boarded for a time with a Deacon of the Presbyterian church. One night I was roused from my sleep by a rap at the door, & I heard the Deacon’s voice exclaiming ‘Arise, Abraham, the day of judgment has come!’ I sprang from my bed & rushed to the window, and saw the stars falling in great showers! But looking back of them in the heavens I saw all the grand old constellations with which I was so well acquainted, fixed and true in their places. Gentlemen, the world did not come to an end then, nor will the Union now."

Abraham Lincoln witnessed the 1833 meteor shower and was still telling stories about it 30 years later.

So what's the point of this whole story? Is there any significance to the fact that the man who escaped slavery to tell the world of its evils and "The Great Emancipator" both saw the same meteor shower? Probably not. Tons of people saw it.

Regardless, it is interesting to think about. Though these men would cross paths several times over the next 30 years, the earliest memory they shared was of a night in 1833, when a 15 year old slave in Maryland and a 24 year old boarder in Illinois watched the stars fall from the sky.

[1] I use "Tuesday night" here to mean, of course, "Wednesday morning." [back]

[2] I say "apparently" because I have never heard of these guys before, so this is all Wikipedia, baby! [back]

[3] Like other meteor showers, the Quadrantids take their name from the constellation from which the meteors seem to emerge. In this case, Quadrans Mural: The Mural Quadrant. Unfortunately for Quadrans Mural, the constellations dumped it like the planets dumped Pluto. [back]

How Long Will a Bootprint Last on the Moon?


image Buzz Aldrin's bootprint (source: Wikipedia)


A couple of months ago, I stumbled across a bunch of pictures of Apollo landing sites taken by one of the cameras onboard the Lunar Reconnaissance Orbiter. The images have a resolution high enough that you can resolve features on the surface down to about a meter. Looking at the Apollo 17 landing site, you can see the trails of both astronauts and a moon buggy. It's pretty cool. It also got me thinking about how long the landing sites would be preserved. More specifically, I want to know how long Buzz Aldrin's right bootprint (shown, incidentally, to the left) will last on the Moon. Since the Moon has no atmosphere, the wind and rain that would weather away a similar bootprint here on Earth are not present and it seems as though the print would last a really long time. But how long? Let's try to quantify it [1]. Pick Your Poison Before we get going, we need to figure out what physical process would be most important in erasing a bootprint from the Moon. Although the Moon lacks the conventional "weathering" we experience on Earth (due to wind, rain, etc), it does experience something called "space weathering." Space weathering is the changing of the lunar surface due to cosmic rays, micrometeorite collisions, regular meteorite collisions, and the solar wind [2]. Of these phenomena, the most apparent and well-studied would be the meteorites which have covered the Moon in craters. We adopt the meteorite impact as our primary means of wiping out a bootprint and restate our question as follows: "How long would it take for a meteorite to hit the Moon such that the resulting crater wipes out Aldrin's right bootprint?" Background As it is currently stated, we can answer our question if we knew the rate of formation and size distribution of the craters on the Moon. We could count up all the craters on the Moon (or a particular region of interest) and tabulate their sizes. This would give us the size distribution. It would also give us a headache and potentially drive us to lunacy [3]. Luckily, someone has beat us to it. Cross (1966) used images from the Ranger 7 and 8 missions to count craters and determine the size distribution of craters in three regions of the Moon. The data for the crater distribution in the Sea of Tranquility (where Apollo 11 landed) are given in the figure below. Cross found that in the Sea of Tranquility, the number of craters with diameters greater than X meters (per million square kilometers) is given by: $$ N(d>X) = 10^{10}\left(\frac{X}{1\~\mbox{m}}\right)^{-2}, $$ which holds for craters with diameters between 1 meter and 10 kilometers (see figure below).


image Figure 2 from Cross (1966)


We can also estimate the rate at which craters are formed from this data. If we assume that the craters formed at a constant rate over the age of the Moon (about 4 billion years), then we get about 2.5 craters with diameters above 1 meter formed in a million square kilometer area every year. This is a "crater flux" for the Moon. Written another way, the crater flux in the Sea of Tranquility is $$F \approx 1\~{\mbox{km}}^{-2} \frac{1}{4\times10^5\~\mbox{yr}}, $$ so we get that roughly one crater with diameter greater than 1 meter is formed on a square kilometer of the Moon once every 400,000 years or so. We now have enough information to do some simulations. Simulation I wrote up a code that simulates craters being formed on a 1 square kilometer patch of the Moon. A crater is randomly placed in the 1 square kilometer region with a diameter pulled from the above distribution. The bootprint is placed at the center of the grid and craters are formed until we get a "hit." At that point, the time is recorded and the run stops. As a sanity check, I thought it would be fun to just let the simulation run without caring if the boot was hit or not. By simulating the craters in this way for 4 billion years, I should get something that looks like the Moon at the present day. Here's a 200 m square from my simulation: image and here's a picture of the same-sized region on the surface of the Moon:


image Cropped from this image (Source: LRO)


Just eyeballing it, things look pretty good. Now it's time for the actual simulation. I ran the simulation 10,000 times and tabulated the amount of time needed before the bootprint was hit. The figure below gives the CDF for the hit times in the simulation. That is, for each time T, we find the fraction of simulations in which the bootprint got hit in a time less than or equal to T. The dashed lines in the plot indicate the amount of time needed to pass for half of the simulations to have recorded a hit. This time turns out to be about 24 billion years.


image (Click for larger, actually readable version)


Conclusions and Caveats Based on the simulations, the bootprint on the Moon would have about even odds of lasting at least 20 billion years if the primary means of destruction is through the formation of a crater from a meteorite. However, there are a few caveats that should be addressed. These deal with either the details of the simulation or the assumptions we have made. In the simulation, we just took at 1 km square patch of the moon and scaled back the "crater flux" accordingly. However, this does not fully account for all possible craters that can form. For example, our simulation would miss an event that hit 50 km away from the target, but had a diameter of 100 km. Obviously this would hit the target, but we are only seeding craters in the 1 square km region. This would mean that the actual lifetime of the bootprint would be less than our 24 billion year figure. Re-running with a 10km by 10km square region, we find a lifetime of 18 billion years. Thus, an increase in area by a factor of 100 only reduces the age by 25%. Considering areas much larger than this makes the simulation prohibitively slow, but the order unity effect does not seem too significant. Additionally, we have made a number of assumptions. The big one is that we have assumed that the craters currently seen on the Moon were formed uniformly in time. In fact, a large fraction of the craters may have been formed when the Moon was still very young (see Late Heavy Bombardment). If this were the case, we would have greatly overestimated the rate of crater formation and thus underestimated the time needed to hit the bootprint. In spite of these caveats, let's take our value of 20 billion years to be accurate. What else can we say? Well, if we are right then we are wrong because the Moon may not last that long (and it's hard to have bootprints on the Moon without a Moon). Current estimates have that the Sun will expand into a red giant and (potentially) destroy the Earth (and the Moon) in about 5 billion years. So a record of the Apollo astronauts' boot sizes could potentially last as long as the Moon [4]. Not bad. Footnotes and Such [1] Now with linked footnotes so Yariv doesn't have to scroll! [back] [2] There was a fairly recent press release about Coronal Mass Ejections from the Sun "sandblasting" the lunar surface. For more info, check here, and note the acronymic acrobatics needed to make them the "DREAM team." But it's totally worth it. [back] [3] A horribly forced pun. But it's totally worth it. [back] [4] Also, Nixon [back]

Report from the Trenches: A CMS Grad Student's Take on the Higgs

Mmmm run172822 evt2554393033
3d Hi folks. It's been an embarrassingly long time since I last posted, but today's news on the Higgs boson has brought me out of hiding. I want to share my thoughts on today's announcement from the CMS and ATLAS collaborations on their searches for the Higgs boson. I'm a member of the CMS collaboration, but these are my views and don't represent those of the collaboration. The upshot is that ATLAS sees a 2.3 sigma signal for a Higgs boson at 126 GeV. CMS sees a 1.9 sigma excess around 124 GeV. CERN is being wishy-washy about whether or not this is actually a discovery. After all the media hype leading up to the announcement, this is somewhat disappointing, but maybe not too surprising. First of all, what does a 2 sigma signal mean? The significance corresponds to the probability of seeing a signal as large or larger than the observed one given only background events. That is, what's the chance of seeing what we saw if there is no Higgs boson? You can think of the significance in terms of a Normal distribution. The probability of the observation corresponds to the integral of the tails of the Normal distribution from the significance to infinity. For those of you in the know, this is just 1 minus the CDF evaluated at the significance. For a 2 sigma observation, this corresponds to about 5%. For both experiments, there was a 5% chance of observing the signal they observed or bigger if the Higgs boson doesn't exist. In medicine, this would be considered an unqualified success. So why is CERN being so cagey? In particle physics we require at least 3 sigma before we even consider something interesting, and 5 sigma to consider it an unambiguous discovery. The reasons why the burden of proof is so much higher in particle physics than in other fields aren't entirely clear to me. I suspect is has to do with the relative ease of running the collider a little longer compared to recruiting more human test subjects, to use medicine as an example. Given what I've just told you that we need a 3 sigma significance in particle physics, why is everyone so excited about a couple of 2 sigma results? Well, the first reason is that both results show bumps at approximately the same Higgs mass. Although it's not rigorous, you can get a rough idea of what the significance of the combined results are by adding the significances in quadrature. This gives us about 2.8 sigma. Higher, but still not up to the magic number of 3. The explanation for the excitement that is most compelling brings us to Bayesian statistics. The paradigm of Bayesian statistics says that our belief in something given new information is the product of our prior beliefs and a term which updates them based on the new information. Physicists have long expected to find a Higgs boson with a mass around 120 GeV. So our prior degree of belief is pretty high. Thus, it doesn't take as much to convince us (or me anyway) that we have observed the Higgs boson. In contrast, consider the OPERA collaboration's measurement of neutrinos going faster than the speed of light. This claims to be a 6 sigma result, but no one expected to find superluminal neutrinos, so our (or at least my) prior for this is much lower. (Aside: If the OPERA result is wrong, it is likely due to a systematic effect rather than a statistical one. Nevertheless, I stand by my point.) The final thing that excites me about this observation is that what we've seen is completely consistent with what we would expect to see from the Standard Model. Forgetting about significances for the moment, when the CMS experiment fits for the Higgs boson mass, they find a cross section that agrees very well with that predicted by the Standard Model. In the plot below, you're interested in the masses where the black line is near 1. The ATLAS experiment actually sees more signal than one would expect. This is likely just a statistical fluctuation, and explains why the ATLAS result has a higher significance. GUIDO HIGGS CERN SEMINAR pdf
page 43 of 60
1ATLAS Higgs pdf page 34 of
68 In conclusion, while CERN is being non-committal, in my opinion, we have seen the first hints of the Higgs boson. This is mostly due to my high personal prior that there the Higgs boson exists around the observed mass. Unfortunately, Bayesian priors are for the most part a qualitative thing. Thus, ATLAS and CMS are sticking to the hard numbers, which say that what we have looks promising, but is not yet anything to get excited about. I'll close by reminding you all to take this all with a grain of salt. There is every possibility that this is just a fluctuation. I'll remind you that at the end of last summer, CMS and ATLAS both showed a 3 sigma excess around 140 GeV, which went away just a month later at the next conference. So let's cross our fingers that next year's data will give us a definitive answer on this question. By the way, if anyone wants to know more, fire away in the comments. I'll do my best.

Physics Challenge Award Show II


image Not a DeLorean. You're doing it wrong.


[Update: Prize Update / Added link to full solutions] Welcome to the second Physics Challenge Award show! [APPLAUSE] Our judges have deliberated for several units of time and I now have in my hands the envelope holding our list of winners. I could easily just tell you who won right now and save everyone some time, but award shows need some suspense to work effectively, so let's first give some tedious background information! [APPLAUSE] You may recall that the winner of the first Physics Challenge contest won a CRC Handbook. We will not be giving out CRCs this time around. We felt that such a prize was far too expensive impersonal, so we have opted this year for something much cheaper from the heart. The following prizes will be awarded to our top three solutions: First Prize: Our first prize winner will receive an actual back-of-an-envelope used in one of our posts (gasp!) signed by all the of the members of the Virtuosi that I can find at colloquium tomorrow. But that's not all! Alemi will also salute in your general direction. Second Prize: For our second prize winner, we appear to have run out of envelopes... but Alemi will still salute in your general direction. You will not see him do this, but you will feel a major disturbance in the Awesome Force (mediated, of course, through the midi-chlorian boson). Third Prize: You will receive no material prize, but on your deathbed you will receive total consciousness. So you've got that going for you, which is nice. Let's first remind everyone what the Challenge problem was. The full text of the problem can be found here, but the gist is basically this: You've created a time machine and you're biggest fear is that you'll be stuck back in the past without any way to communicate to the future that your design worked and you deserve all kinds of Nobel prizes. The solution should be able to last long periods of time (who knows how far back in time you'll go?), should maximize the chances of modern people finding it, and be able to convince people that you have in fact gone back in time. Alright, let's get to some solutions already! First Place: The first place solution comes from Christian, who uses some biological wrangling to solve the time traveller conundrum. With some information from the announcement of "synthetic life" and some bio how-to from an entity known only as "steve," Christian plans to implant a message into the DNA of bacteria. The message will contain his name, identifying information, and the url of a website which will (presumably) contain a video of him with one hand outstretched saying "Nobel prize please." Let's see how this solution satisfies our criteria for a successful solution. Does it work for an arbitrary amount of time? It appears to, so long as the bacteria manage to survive and the message doesn't become too garbled over time (perhaps some error-correction might be useful). Additionally, if one is worried about introducing non-native bacteria to the wild you could bring back a bunch of bacteria that were known to exist over wide periods of time and just release those alive at the time. Will modern humans find it? It seems that geneticists are decoding just about any genome they can get their hands on, so this is a strong possibility. Would it convince people that someone travelled in time? If the bacteria has dispersed enough, shows enough variation over geographic regions, and contains specific identifying information about a missing person who has allegedly created a time machine, I think that's pretty strong evidence. Neato, gang! Second Place: The second place solution comes from Kyle, who offers a space-based answer. Kyle suggests etching detailed plans of the time travel mechanism (flux capacitor) onto a durable metal and putting that bad boy into space. He suggests that anyone capable of building a fully functional time machine should have no problem launching a small satellite. Fair enough. Additionally, the satellite would use some kind of solar power or the like to produce a low-power radio signal. In fact, this signal would only need to spit something out once every year or ten years or something. Since radio communication precedes space exploration, the detection of an artificial satellite sending a message would attract a fair deal of attention. The plans and successful reproduction of the time machine would then seal the deal. Does this solution satisfy the necessary conditions? I think so. Assuming all goes according to plan, this would easily be detected by modern people and, assuming the time machine plans are accurate, would provide indisputable proof. My main concern would be that the satellite could be launched and survive to the present. Modern satellites need constant boosts to stay in orbit, without which they fall back onto Earth and burn up. One potential solution would be to put it on the Moon. This is technically much more difficult, but hey, you just created a time machine! Also, putting it on the moon then allows for a totally rad recreation of the Monolith scene in 2001: A Space Odyssey. Third Place: The third place solution comes from Yariv. Though Yariv did not submit a solution through the proper channels (he follows no one's rules, not even his own), he was overheard to give a solution. While the Physics Challenge planning committee was discussing the problem over lunch, Yariv flippantly dismissed the entire premise as "trivial" and suggested a two-word solution: "radioactive paint." Personally, I like the idea of bewildered archaeologists finding a cave painting of Yariv riding a dinosaur done using a variety of radioactive paints which all date back 200 million years. For this amusement, I award Yariv the third place prize for this contest. As a member of the Virtuosi, however, Yariv is ineligible to receive a prize and instead receives 5 demerits on his record for his willful disregard of our institution's rules and excessive flippancy. One more slip-up and you'll lose your badge! Full solutions are up on the Challenge website. Thanks for joining us for this episode of Physics Challenge Award Show, and thanks to everyone who submitted a response! First and Second Prize Winners: We present the following in partial fulfillment of our prize offer.


image For those who solve problems (he salutes you)


Betelgeuse, Betelgeuse, Betelgeuse!


image 
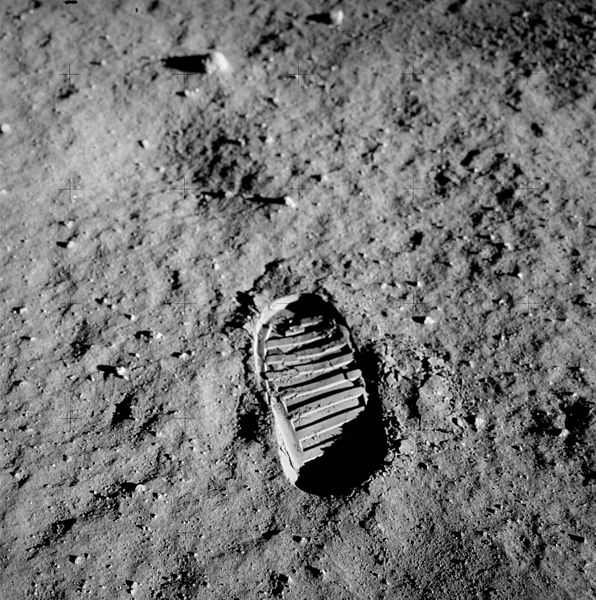
A very cold person points out Betelgeuse


Betelgeuse is a massive star at the very end of its life and could explode any second now! Every time I hear that I get really really excited. Like a kid in a candy store that's about to see a star blow up like nobody's business. This giddiness will last for a solid minute before I realize that "any second now" is taken on astronomical timescales and roughly translates to "sometime in the next million years maybe possibly." Then I feel sad. But you know what always cheers me up? Calculating things! Hooray! So let's take a look at the ways Betelgeuse could end its life (even if it's not going to happen tomorrow) and how these would affect Earth. First, a little background. Betelgeuse is the bright orangey-red star that sits at the head/armpit of Orion. It is one of the brightest stars in the night sky. Its distance has been measured by the Hipparcossatellite to be about 200 parsecs [1] from Earth (about 600 light years). Betelgeuse is at least 10 times as massive as our Sun and has a diameter that would easily accomodate the orbit of Mars. In fact, the star is big enough and close enough that it can actually be spatially resolved by the Hubble Space Telescope! Being so big and bright, Betelgeuse is destined to die young, going out with a bang as a core-collapse supernova. This massive explosion ejects a good deal of "star stuff" into interstellar space [2] and leaves behind either a neutron star or a black hole. Alright, now that we're all caught up, let's turn our focus on this "massive explosion" bit. What kind of energy scale are we talking about if Betelgeuse blows up? Well, a pretty good upper bound would be if all of the star's mass (10 solar masses worth!) were converted directly to energy, so $$ E_{max} = mc^2 = 10M_{\odot}\times\left(\frac{2\times10^{30}\~\mbox{kg}}{1\~M_{\odot}}\right)\times \left(3\times10^8\~\mbox{m/s}\right)^2 $$ which is about $$ E_{max} \sim 10^{48}\~\mbox{J} $$ and that's nothing to shake a stick at. But remember, this is if the entire star were converted directly to energy, and that would be hard to do. Typical fusion efficiencies are about \~1% [3], so let's say a reasonable estimate for the total nuclear energy available is $$ E_{nuc} \sim \eta_{f} \times E_{max} \sim 10^{-2} \times 10^{48}\~\mbox{J} \sim 10^{46}\~\mbox{J}. $$ This is the total energy released by a typical supernova. As it turns out though, 99% of this energy is carried away in the form of neutrinos and only about 1% is carried away in photons. Since we are mainly concerned with how this explosion will affect Earth, and the neutrinos will just pass on by, we will only consider the 1% of energy released in photons that would reasonably interact with Earth. That gives us $$ E_{ph} \sim 0.01 \times E_{nuc} \sim 10^{44}\~\mbox{J}. $$ Neato, so that's the total amount of energy released in a supernova in the form of photons. How much of this energy would be deposited at the Earth if Betelgeuse exploded? Well, if the energy is deposited isotropically (that is, the same in all directions), then the fluence (or time integrated energy flux) is given by $$ F_{ph} = \frac{E_{ph}}{4\pi d^2}. $$ All this is saying is that the total energy release by the supernova spreads out uniformly over a sphere of radius d, so the fluence will give us the amount of energy deposited in each square meter of that sphere (the units of fluence here are J/m^2). The total energy deposited on Earth is then $$ E_{\oplus} = F_{ph} \times \pi R^2_{\oplus}. $$ Hot dog! Let's plug in some numbers, already. The total energy deposited on the Earth by a symmetrically exploding Betelgeuse at a distance of d = 200 pc (where 1 pc = 3 10^16 m) is $$E_{\oplus}=\frac{E_{ph}}{4\pi d^2}\times\pi R^2_{\oplus}\sim 10^{19}\~\mbox{J}\left(\frac{E_{ph}}{10^{44}\~\mbox{J}}\right)\left(\frac{d}{200\~\mbox{pc}}\right)^{-2}.$$ Well, 10^19 J certainly seems* like a lot of energy. In fact, it is roughly the amount of energy contained in the entire nuclear arsenal of the United States [4]. But it is spread over the entire atmosphere. Is there a way to gauge how this would affect life on Earth? We could see how much it would heat up the atmosphere using specific heats: $$ E = m_{atm}c_{air}\Delta T $$ where c is the specific heat of air (\~10^3 J per kg per K). Oops, looks like we need to know the mass of the atmosphere. But we can figure this out, the answer is pushing right down on our heads! We know the pressure at the surface of the Earth (1 atm = 101 kPa) and that pressure is just the result of the weight of the atmosphere pushing down on us. Since pressure is just force / area, we have $$ P = F/A = m_{atm}g / A_{\oplus} $$ So $$ m_{atm} = \frac{P\times4\pi R^2_{\oplus}}{g}=\frac{10^5\~\mbox{Pa}\times4\pi (6\times10^6\~\mbox{m})^2}{9.8\~\mbox{m/s}^2}\approx4\times10^{18}\~\mbox{kg}.$$ Neato, gang. So we could see a temperature rise of about $$ \Delta T = \frac{E_{ph}}{m_{atm}c_{air}}=\frac{10^{19}\~\mbox{J}}{4\times10^{18}\~\mbox{kg}\times10^3\~\mbox{J/ kg K}}\approx0.003\~\mbox{K}, $$ or three one-thousandths of a degree. Remember, too, that this will be an upper bound since we are assuming that all this energy is deposited into the atmosphere before it has a chance to cool. In fact, if the energy is deposited over the course of hours or days, this value will be much less. So it looks like we've wrapped this thing up: Betelgeuse exploding will most certainly not put the Earth in any danger. Or did we? We have considered the case of a symmetric supernova, but there's more than one way to blow up a star. Massive stars can also end their lives in a fantastic explosion called a gamma-ray burst (GRBs to the hep cats that study them, some fun facts relegated to [5]). GRBs are still an intense area of current study, but the current picture (for one type of GRB, at least) is that they are the result of a star blowing up with the energy of the explosion focussed into two narrow beams (see picture below). Since the flux isn't distributed over the whole sphere, GRBs can be seen at much greater distances than a typical supernova.


image 
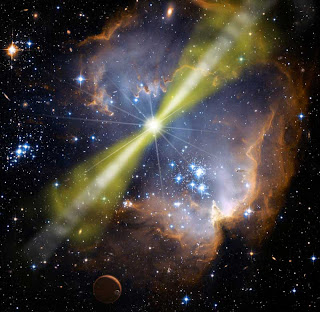
Example of a gamma-ray burst, with the explosion in two beams.


So how will this change our answer? Well, it's going to change the fluence we calculated above. Instead of spreading the energy out over the whole sphere, it's only going to go to some fraction of the 4pi steradians. So we get $$ F_{ph} = \frac{E_{ph}}{4\pi f_{\Omega} d^2}, $$ where f_{omega} is called the "beaming fraction" and tells us what fraction of the sphere the energy goes through. Typical GRB beams range from 1 to 10 degrees in radius. Converting this to radians, we can find the beaming fraction as $$ f_{\Omega} = \frac{2 \times \pi \theta^2}{4\pi} \approx 10^{-4}\left(\frac{\theta}{1^\circ}\right)^2,$$ so the beaming fraction is 10^-4 and 10^-2 for a beam angle of 1 degree and 10 degrees, respectively. Alright, so now we can redo the calculations we did for the supernova case, but keeping this beaming fraction around. The total amount of energy that would hit Earth is then about $$E_{\oplus}=\frac{E_{ph}}{4\pi f_{\Omega} d^2}\times\pi R^2_{\oplus}\sim 10^{23}\~\mbox{J}\left(\frac{E_{ph}}{10^{44}\~\mbox{J}}\right)\left(\frac{d}{200\~\mbox{pc}}\right)^{-2}\left(\frac{\theta}{1^\circ}\right)^{-2}.$$ Holy sixth-of-a-moley! Continuing as we did above, we find that this could potentially heat up the atmosphere by $$ \Delta T = \frac{E_{ph}}{m_{atm}c_{air}}=\frac{10^{23}\~\mbox{J}}{4\times10^{18}\~\mbox{kg}\times10^3\~\mbox{J/ kg K}}\approx3\~\mbox{K}\left(\frac{\theta}{1^\circ}\right)^{-2}, $$ which is certainly non-negligible. Now, this won't destroy the planet [6], but it could make things really uncomfortable. This will be especially true when you realize that a fair amount of the energy carried away from a gamma-ray burst is in the form of (wait for it...) gamma-rays, which will wreck havoc on your DNA. Remember, though, that this is an absolute worst-case scenario since we have assumed the smallest beaming angle. But this may still make us a little nervous, so is there anyway to figure out if Betelgeuse could, in fact, beam a gamma-ray burst towards Earth? Yes, yes there is. Jets and beams like those in GRBs typically point along the rotation axis of the star [7]. If we could determine the rotational axis of Betelgeuse, then we could say whether or not there's a chance it's pointed towards us. It just so 
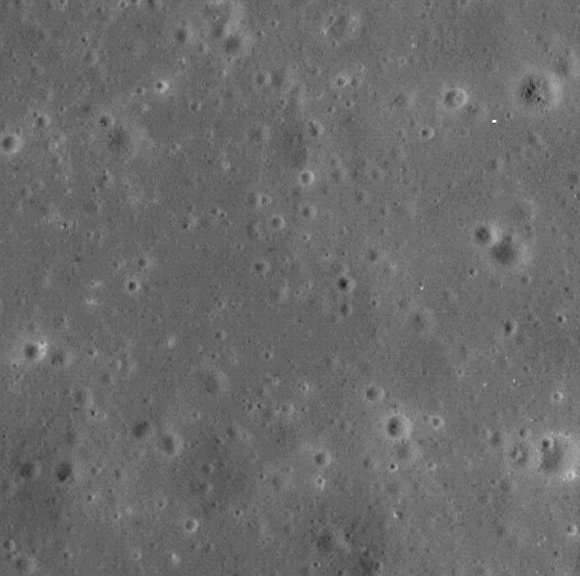
happens that Betelgeuse is the only star (aside from our Sun) that is spatially resolved. If you could measure spectra along the star, you could look for Doppler shifting of absorption lines and say something about the velocity at the surface of the star. Luckily, this has already been done for us (see, for example Uitenbroek et al. 1998). These measurements are hard to do since the star is only a few pixels wide, but it appears as though the rotation axis is inclined to the line-of-sight by about 20 degrees (see figure below). That means this would require a beam with at least a 20 degree radius to hit the Earth. This appears to be outside the typical ranges observed. So even if Betelgeuse were to explode in a gamma-ray burst, the beam would miss Earth and hit some dumb other planet nobody cares about.


image 
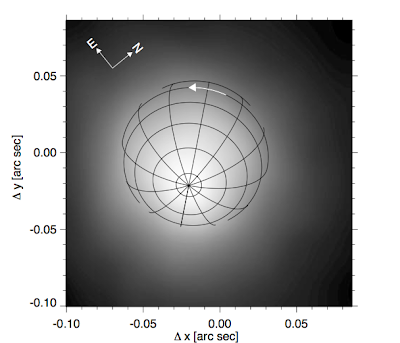
Figure reproduced from Uitenbroek et al. (1998)


Alright, so the moral of the story is that Betelgeuse is completely harmless to people on Earth. When it does explode, it will be a brilliant supernova that would likely be visible at least a little bit during the day. It will be the coolest thing that anyone alive (if there are people...) will ever see. Sadly, this explosion could take place at just about any time during the next million years. Assuming a uniform distribution over this time period and a human lifetime of order 100 years, there is something like a 1 in 10,000 chance you'll see this in your life. Feel free to hope for a spectacular astronomical sight, but don't lose sleep worrying about being hurt by Betelgeuse! Semi-excessive Footnotes: [1] This has nothing to do with the Kessel Run. For a description of the actual distance unit see Wikipedia. For a circuitous retconning to correct for one throwaway line in Star Wars, see Wookieepedia. [2] This is how anything heavier than helium gets distributed throughout the universe. The hydrogen and helium formed after the Big Bang gets fused into heavier elements in stars and then dispersed out through supernovae. In fact, most things heavier than Iron actually require supernovae to even exist. If you have any gold on you right now (I'm looking at you Mr. T), that only exists because a star exploded! [3] Let's consider the case of turning 4 protons into a Helium nucleus. Helium-4 has a binding energy of about 28 MeV, which means that the total energy of a bound He-4 nucleus is 28 MeV less than its free protons and neutrons (in other words, we need to put in 28 MeV to break it up). So the process of turning 4 protons into a Helium nucleus gives off 28 MeV worth of energy. But we had a total of 4 times 1000 MeV worth of matter we could have turned into energy. Thus, the process was 28 MeV/4000 MeV \~ 0.7% efficient at turning matter into energy. [4] Sometime last year, the United States disclosed that its nuclear arsenal as of Sept 2009 was something like 5000 warheads. Assume these to be Megaton warheads. A Megaton is about 4 10^15 J, so the total energy in the US arsenal is about 5000 * 4 10^15 J = 2 * 10^19 J. [5] A fun fact about GRBs: They were discovered by a military satellite looking for illegal nuclear tests, which would emit some gamma-rays. Instead of seeing a signal on Earth, they saw bursts coming from space. I really really hope that someone's first thought was that the Russians were testing nukes on the Moon or something. We must not allow a moon-nuke gap! [6] We here at the Virtuosi are contractually obligated to only destroy the Earth in our posts on Earth day. I apologize for any inconvenience this may cause. [7] I am not exactly sure why this is the case. It is certainly observed to be the case and I thought there was a straightforward explanation for why this was the case, but I don't really have a good explanation. Although, maybe there just isn't a good one yet. [8] For comparison, there is about a 1 in 3000 chance you'll be struck by lightning in your lifetime.