F-91 Revisited
 Farmer Uncle Sam...with a rifle. (Image Credit: Wikipedia)
Today was a sunny exception to the grey overcast rule of weather in Ithaca. I should be overjoyed by this anomaly, spending the day outside flying a kite or playing frisbee with a border collie in a bandanna. Unfortunately, today was also the beginning of Daylight Savings Time (DST) - my least favorite day of the year. For my colleagues unfamiliar with this temporal travesty (I'm looking at you Arizona), let me briefly explain DST. Once a year, the time lords steal a single hour from us and place it in an escrow account for future disbursement, presumably in some elaborate scheme to gain the favor of hat-throwing farmer-clock hybrids (see image left). The details are a bit murky, but the net result is that today I had one less hour to do my very favorite thing in the whole wide world - sleep. It also means that I have to set my watch, so I figured I'd check in and see how well my previous model for time-loss in my watch has held up. About a month ago, I looked at how my watch slowly deviated from the official time (the original post can be found here and a helpful clarification by Tom can be found here). Based on a little over 50 days worth of data, I found that my watch lost about 0.35 seconds per day against the official time. About 50 days have passed since my last measurement and today when I set the watch, so I thought it would be interesting to see how well my model fit the new data. The old data are presented in Figure 1 in blue, the old best fit line is in red, and the new data point (taken this morning) is in green. As always, click through the plot for a larger version.
 Figure 1
The new data point appears to be in fair agreement with the old best-fit model, but it's a little hard to see here. Zooming in a bit, though, we see that the model lies outside the error bar of the new data point.
 Figure 2
So is this a big deal? Not really. But if it will help you sleep at night, we can redo the fitting with the new data point included to see how much things change. The the plots with the updated model to include all data points are provided below with the old data in blue and the new point in green.
 Figure 3
The new model looks a whole lot like the old one, except the best fit line now appears to go through the new data point. Zooming in a little, we see that it does indeed fall within the error bars of our new point.
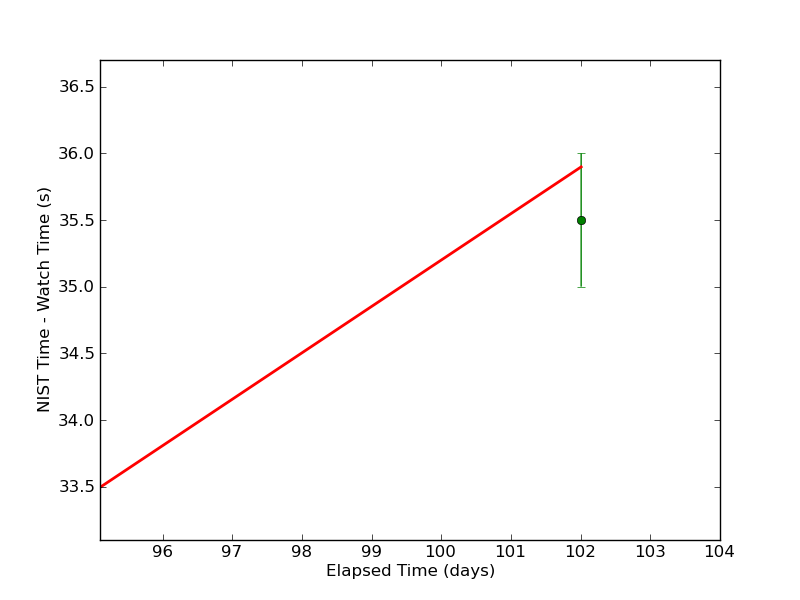 Figure 4
Alright, so the new model fits with our new point, but how much did the model have to change? Well, the fit to just the old data gave an offset of 0.36 seconds and a loss rate of 0.35 seconds per day. The new model has an offset of 0.40 seconds and a loss rate of 0.348 seconds per day. Overall, not a significant change. It looks as though I may continue to not worry about the accuracy of my watch. I have set it to match the official time and have no intention of fiddling with it until I have to set it again at the end of Daylight Savings Time - my favorite day of the year.
Comments
Comments powered by Disqus