Counting Critters


image This picture allows us to set a lower bound on the number of creatures that ever lived of \~4.


We recently had a big book sale [1] here in town where books were being sold for about a quarter. Needless to say, I bought far more than I'll probably ever need or read. One of the books I bought was called General Paleontology by A. Brouwer [2]. Anyways, I didn't really make it too far in the book. In fact, I only made it to the first sentence of the second paragraph of the first chapter, when I encountered this line: "The number of individuals which has populated the Earth since life began is beyond estimation." Horse feathers, I say! Horse Feathers! The number of things that ever lived may very well be unknowable, but it's certainly not beyond estimation. So below, Alemi and I each provide an estimate for the total number of creatures that have ever lived on Earth. We flipped a coin and I lost, so I guess I'll go first. My estimation will be a genuine guess-y kind of estimate that doesn't draw too heavily on too many physical considerations. Instead, I will formulate a series of assumptions and base my final answer on that. So assuming my assumptions are valid, the answer should give a reasonable estimate to the total number of creatures that have ever lived. My assumptions are as follows: (1) The number of individuals that have ever lived will be almost entirely dominated by the number of bacteria that have ever lived on Earth. So to leading order, all the life that has ever lived on Earth is bacteria (or something similar). (2) Life began at some time, T, in the past and immediately spread to all places on Earth. Hey, man, it's the power of geometric progression! (3) The majority of life is found within h = 1 m from the surface of water. I picked this number since it's roughly (order of magnitude) how far down I can see in really clear water. Most of the life will be photosynthetic and thus need a fair amount of sunlight. (4) The number density of organisms in water is n \~ 10^5. I have no real justification for this. (5) The average lifetime of an organism is t \~ 1 hr. Alright, so if these assumptions are valid (a big if [3]), then the following prediction should be fairly accurate. So the total volume in which these creatures may live is just the shell of the Earth down to about a meter: $$ V = 4 \pi R_{\oplus}^2 h $$ where R = 6 * 10^6 m is the radius of the Earth. Alright, so the number of creatures at any given moment will be the volume times the number density which I will take to be n \~ 10^5. That will give us the total number of creatures at any given moment. But we want it for all the moments. So I will take the total number of "generations" to be the time life has been around divided by the average lifetime of a given organism. Putting this all together gives $$N = 4 \pi R_{\oplus}^2 h \times \frac{T}{t} $$ Plugging in some numbers I get: $$ N \sim 10^{39} \left(\frac{h}{1\~\mbox{m}}\right)\left(\frac{n}{10^5\~\mbox{cm}^{-3}}\right)\left(\frac{T}{3\times10^9\~\mbox{yrs}} \right)\left(\frac{t}{1\~\mbox{hr}} \right)^{-1}$$ So for the nominal values I've plugged in, I'll get that about 10^39 creatures have ever lived on Earth [4]. I've left my equation in a dimensionless form above, so if you think my individual estimates are garbage, you can easily plug in your own estimates to see how things change. Except for the completely arbitrary factor for the average number density of organisms per cubic centimeter of water, I feel alright about this estimate. And I'm fairly confident that the number density will not be off more than about 3 orders of magnitude either high or low. So my final estimate is: $$ N \sim 10^{39 \pm 3} $$ I promised that there would be two estimates, so I present below in picture form, Alemi's back-of-the-wrapper estimate.


image 
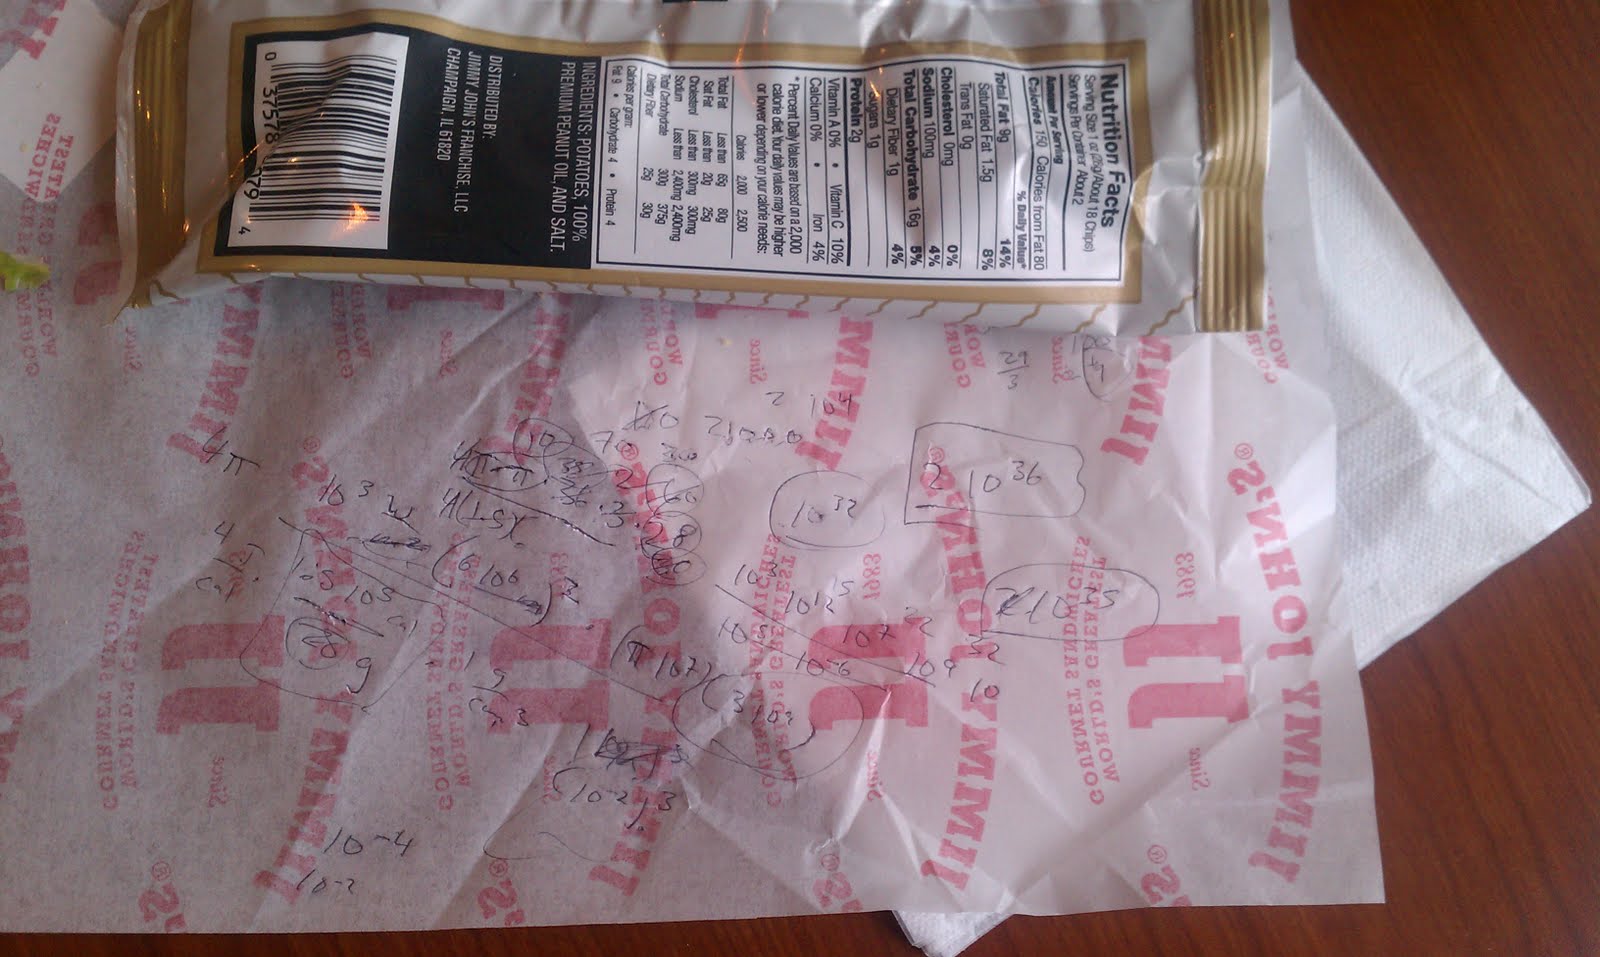
Click for the full Jimmy Johns experience


To explain these scribbles, I now cede the floor (and the mic) to Alemi. [ SEAMLESS TRANSITION ] So, when Corky posed this question to me while we ate some tasty sandwiches, another approach came to mind. Namely, I wanted to try to estimate the number of critters that have ever lived by putting some kind of energy bound on the number. Ultimately, all critters come from the sun. That is, all life on Earth is only able to exist in so much as it consumes energy, and for almost all life [ignoring the under ocean heat vent guys], the energy they consume, one way or another comes from the sun. So, let's estimate the number of critters in three parts (1) We need the energy the Earth recieves from the sun. (2) We need to estimate the energy density of life (3) These two things, combined with a characteristic length or volume scale for a critter would enable us to figure out the rate at which the Earth could produce critters. (4) Assuming this rate and a time scale for how long life has been around on the Earth would give us a total number of critters. Let's begin (1) Energy from the sun. Corky and I happen to know that the solar flux on the sun is roughly 1000 W/m^2. Multiplying this by half the surface area of the earth gives us a rough total solar flux $$ (1000 \text{ W/m}^2) ( 2\pi R_{\oplus}^2) \sim 2 \times 10^{17} \text{ W} $$ (2) Energy density of critters For this we used the bag of potato chips we had on hand, assuming that all life matter has roughly the same energy content. The bag of chips was 150 calories in a serving size of 28 grams. This and assuming that life forms are the density of water gives us a life energy density $$ \left( \frac{ 150 \text{ kcal} }{ 28 \text{ g}} \right)\left( \frac{ 1 \text{ g}}{ \text{ cm}^3} \right) \sim 2 \times 10^4 \text{ J/cm}^3 $$ (3) Length scale of critters We assumed that bacteria are the most abundant life form, so we chose a length scale of 100 microns. Putting these pieces together gives $$ \frac{ 2 \times 10^{17} \text{ W} }{ \left( 2 \times 10^4 \text{ J/cm}^3 \right) \left( 100\ \mu\text{m} \right)^3 } \sim 10^{19} \text{ 1/s} $$ Which is our estimated critter creation rate (4) Time scale for life generation Finally, we estimate that life creation has been chugging along on earth for about 3 billion years, this gives us our final estimate for the number of critters that have every lived $$ \left( 10^{19} \text{ 1/s} \right) \left( 3 \times 10^9 \text{ years} \right) \sim 10^{36} $$ So, there we have it. If the Earth was 100% efficient at converting solar energy into life, and that life is characteristically the energy density of a potato chip and the size of a bacteria, we should have had 1 billion billion billion billion critters ever. To make us feel a little better we would like to tack on a 10% efficiency, since we don't actually expect the Earth to be 100% efficient, and because 10% seems to be the rule of thumb efficiency estimation used when it comes to food chains and the like, so our final estimate, motivated purely by physics is $$ \boxed{ \text{ Total number of critters ever } = 10^{35\pm 3} } $$ This number seems pretty good, and is in general agreement with Corky's earlier method. Notice that the only parameter we are a little worried about the is the length scale, especially because our final answer depends on the inverse cube of this number, so, our error is probably something around 3 orders of magnitude, as before, since an order of magnitude goof in the size would cause 3 orders of magnitude error in the final estimate. So there you have it. Two not-egregiously-horrible estimates for the total number of critters that have ever lived. All in all, I think that book was a quarter well spent! Unnecessary footnotes: [1] This is a bit misleading. They actually sold books of all sizes. [2] I like to read about paleontology and such just in case I'm ever sent back in time. This way, I'll know what dinosaurs are safe to eat. [3] Here's a bigger if: if [4] FUN FACT: The total number of atoms in all the people on Earth is roughly 10^39. A proof of this is left as an exercise for the reader.

Day in the life of Clicky

imageRemember when you first learned about other planets and their many fun facts? You were probably bombarded by such truisms as: "Jupiter is approximately the mass of 318 Earths, has a orbital period that is 4,300 Earth days, is made out of pure love, and is mostly transparent." Well, I was curious about what Clicky's day was like in terms of Earth days. When did Clicky get to sleep, when did he eat dinner, what is his orbital radius and eccentricity? To do this, I looked at only the 3rd column of the data that you may or may not have downloaded yesterday from here. Starting out, it should be noted that this is not an ordinary time series where you have some value measured at given intervals. It is actually a series of time points at which a click was entered. I thought it would be most natural to go ahead and bins these to give a sense of the access to Clicky over the past two months. It looks something like this: image Well, that wasn't as informative as I had hoped. We see some spikes here and there with a general trend toward neglect and abandonment towards the end of the second month. What if we take these days and bin them into one single day worth of traffic? We get this: image Again, not so informative yet, but we are definitely starting to see some structure in the day. In particular, there is a lot of activity in the afternoon and evening with a definite lull around 5pm. There is also a distinct minima around 5am. It appears that Clicky is on the average most active between noon and 9pm, getting a break through most of the night. Next, let's look at the autocorrelation of the times. For standard time series, the autocorrelation is defined to be $$ C_{ss}(\tau) = \int_{-\infty}^{\infty}s(t) * \bar s(t-\tau) dt $$ which measures the amount of similarity in a signal as a function of the time separation between two points. Again, we don't have a continuous signal, so our autocorrelation function is instead a histogram of the all-pairs differences in the data points that we do have. That is, start at the first time point and subtract it from all of the other time points in the series. Then, move to the next data point and subtract it from all the subsequent times while keeping tracking of all of these differences. This is our autocorrelation in real space. image We can also zoom in and smooth the data a bit imageAh, now there we go. We see a distinct over-abundance of time differences around 1 day, 2 days, etc. What is the primary oscillation we see in the correlation? To see that, let's look at the frequency space autocorrelation and plot its power, or square. imageFinally, we get the primary component of the variation of Clicky's visits throughout the 2 month period that he was in operation. It occurs, to within error, at 1 day. No very surprising at all. I'm sure we could look more closely at the peak and its width, but I am satisfied to say that Clicky's day is defined by the Earth day to within a few percent. *In response to more messages in Clicky, we agree that it is "So slow." Rest assured, management is looking into the problem.

Clicky Data v1.0

image As we sift through the Clicky data Corky presented yesterday, let us not forget the Clicky that came before. Let us not forget the Great Server Move of 2011 and the great pains we felt while waiting for Clicky to come back to us: Corky sat in his room crying into his pillow, Alex was pressing his arrow keys longingly, and I just couldn't seem to get up in the morning. Let us not forget the many hours in which untold numbers of anonymous internet users tried in vain to spell simple words using only discrete steps on a finite lattice. Let us not forget the Great Server Crash that caused the physics department to be charged extra for data usage. Let us not forget Clicky v1.0. So today we remember him, our beloved Clicky v1.0, by releasing his data as well. It can be found close to the other Clicky data dump from yesterday at this location: Download Clicky v1.0 Be warned, this was actually available to the anonymous internet and there are a few things that may surprise you. That being said, the last half of this data set is actually comprised of multiple users interacting with Clicky at once so it should have different statistics than yesterday's data, though we have yet to sort through that too. More of our analysis is to follow.. Also, props to whoever made the dinosaur.

Clickin' the Night Away

Hey, everybody! Do you remember Clicky [1]? Well, we finally got around to analyzing data, so here goes. But first, a brief summary. Matt, Alemi and I came up with the idea for Clicky in the beginning of April. Perhaps "idea" is a bit too generous... it was really just a passing thought: "Hey wouldn't it be cool if we had an internet Ouija board?" It was just a stupid lunch-time discussion that wouldn't have gone anywhere had Alemi and Matt not taken it as some sort of challenge. So after a few hours that night we had Clicky. To say we had some goal with Clicky would be an overstatement. But, if anything, we were kind of hoping to see some sort of Brownian motion. We figured if we had lots of people pulling on the same dot, some kind of Brownian walk would show up. This was grossly overestimating how many people actually view this blog and it turned out that most of the time Clicky was moved by one person at a time. Anyway, what we did end up finding was more interesting than just a Brownian random walk... Behold, in its full 133,000 point glory, Clicky!


image Far View of Clicky. Click to super-size.


Well, I guess that isn't that impressive. But you can click on it for a larger view or download the data and plot it yourself from here. Alternatively, you can view a super-duper large version of the above picture that will almost certainly make your browser sad (seriously, it's big) at his website here. We note that each step taken by Clicky is 1 unit long, and the above image goes about 2500 on the y-axis and about 5000 in the x-axis. Though we make no explicit comparison between our humble traveler and the great men of lore, we do note that Clicky's long and tortuous path both begins and ends in Ithaca [2]. Now the big picture is all well and good for some folks, but let's zoom in a bit. We'll now zoom into a portion that is about 1000 by 1000 and is located about in the middle of the Clicky map.


image Mid-level view of Clicky. Click for a more cromulent view.


So this view is pretty neat. Whereas the previous view appeared largely random, we start to seem some structure here. We can see that some brave soul has made a spiral that, at its biggest, goes for about a hundred squares (remember, you could only see ten squares at a time!). We can also see that most of the steps are small and tend to cluster, but every now and again there is a large jump to uncharted territory. Neat! Let's zoom in a bit more. Now we will zoom down to about a 100 by 100 square.


image Near view. Note the primitive form of communication.


So this is neat. We see some very non-random structures. We see spelled out the phrase "IM IN FIVE-TEN" (Phys 510 is the required graduate physics lab here). This was actually not uncommon. There are lots of little communications that go on throughout the Clicky map. Most are just people marking their territory, but there are some fun ones. If you find anything neat, let us know! (MILD WARNING: As this was open to The Internet, we make no claims that everything written is appropriate, but the worst thing I've seen so far is "butts lol." So I think you're safe). Now dedication to write something is fine, but how about some real dedication. I found this little Italian gem here, although its means of creation are suspect, to say the least...


image It's a Mario!


Hot dog. So is there anything quantitative we can say about the path of Clicky? Sure. Let's take a look at the distribution of step sizes. By step sizes I mean the lengths of continuously straight paths. So if you go right for 5 clicks in a row, the length will be five. Unfortunately, this will not include the lengths of diagonal paths. Anyway, here's what I get:


image Power-law fit to Click step-size distribution


The red line here is a maximum likelihood fit to a power law distribution of the form: $$ p(x) \propto x^{-\mu}. $$ (For an outstanding reference guide to fitting power law distributions see this preprint.) So it appears as though we have a power law distribution here (but see the paper above!). Well what does that mean? Well it seems we have a roughly random walk path where the step sizes are pulled from a power law distribution. This type of random walk is called a Levy flight (a nice tutorial here) and shows up (or at least appears to) in all kinds foraging patterns in animals (for example, sharks). To test this, we can simulate a Levy flight on a grid like Clicky. Doing this with the power law found in the above fit gives:


image Impostor Clicky!


Not exactly the same, but still looks pretty close! So that's all for this installment of Virtuosi Theatre, but there's still a whole lot to be analyzed with Clicky. With that much data, you're bound to find something (whether it's there or not!). So if you find something neat, let us know. (Remember the data can be downloaded as a txt file here).


Superfluous Footnotes: [1] Yes, I know you loved him as Mr. Dottington. I did too! But apparently "the man" thought that was a "lame" name and made it all "commercial" with the buzzname Clicky. So it goes. [2] Although if Clicky is Odysseus, then I guess that makes you Homer. D'oh! [3] [3] All my knowledge of "culture" comes from The Simpsons.

Anatomy of an Experiment I - The Question


image Warning: picture has little or no relation to this post.


I realized the other day that I've seen a lot of people talk about research results, but it is much more rare that I see someone talk about how we do research. I think that may be because, to us as scientists, the process is second nature. We've been doing it for years. Other folks may be less familiar with the process though. With this in mind, I'm going to do a short series of posts focused on how we do an experiment. Not the results, not so much the physics, but the process that we go through to create, setup, and carry out an experiment. As my example I'll use a short little experiment that I built from the ground up in the last few weeks, that I'm currently in the process of (hopefully) wrapping up. Today I'll talk about the driving force behind almost any experiment: The Question. It might be argued that there are two types of experiments. There are those that set out to answer a specific question, and those that set out to explore what happens under certain conditions (explore some part of phase space). An example of the first type that comes immediately to mind is the recently announced results from Gravity Probe B (GP-B). This was an experiment designed with one goal in mind, to test the validity of einstein's theory of general relativity, specifically geodesic precession and frame dragging. They asked the question, built the apparatus, and then got results. Here's a spoiler from the article: Einstein was right, to remarkable precision. I'm going to mostly ignore the second type of experiment. While very important, I argue that those exploratory experiments are (almost?) always done on experimental apparatus that was built for another experiment. You don't spend the time, money, and energy to build an experimental apparatus without having good evidence that it's worth doing, that is, without expecting to see something. This brings me to The Question. The name might be misleading, the motivation for an experiment might not be a question (though it can usually be phrased as one). One common motivation is to test theoretical predictions, as was the case with GP-B. Theory without experimental verification is empty. It may sound nice, but we can't trust it unless we've tested it against what nature actually does. Sometimes theory develops because of experimental results, for example the knowledge of the quantization of light came out of anomalous experimental effects of the photoelectric effect and blackbody radiation (among others). Other times, experiment develops to test theory, the GP-B and the Large Hadron Collider for example. Another common motivation is a question based on a physical observation, for example: how does a fly fly? That question is, as these things go, very simply stated. For an idea of how complicated they can get, just take a look at any recent collection of articles from any physics journal, wherein we find things like the form and source of 'itinerant magnetism in FeAs' (grabbed from a recent Phys. Rev. B article). I classify a third type of question, one that is more process based: "How can we do X?". This third category is where the question that motivates (at least in the broad sense) the experiment I'm going to describe comes from. I can phrase it as: "How can we successfully cryopreserve biological samples?" For those unfamiliar with biological cryopreservation, this is something I discussed almost a year ago. From there, we get into smaller questions, most of those are type two, based on physical observations. This particular small experiment has grown out of my work on cryopreservation, and has more to do with the structure of water on freezing. Over the past year, one of the projects I've been working on has been to measure the so called critical warming rate of aqueous solutions. This is the rate at which you have to warm vitreous aqueous solutions (see my earlier cryopreservation post for more details) to prevent ice formation on warming. The question that has grown out of this work is: how does the cooling history of my vitreous sample affect the critical warming rate? Having arrived at the question, we'll next discuss the apparatus.

End of the Earth VI: Nanobot destruction

image

Let's destroy the earth with technology. A while ago, I read the novel Postsingular by Rudy Rucker, and in the first chapter the Earth gets destroyed, and then undestroyed, and then the novel unfolds and the Earth's likelihood is threatened again, and it looks like the Earth will be destroyed, but it isn't. How does all of this craziness happen you might ask: nanobots! The story revolves around little self-replicating robots. The story explores what it would be like to live in a world where every surface on Earth was coated in little computers, all of which were networked together. It's certainly a neat idea, but whenever you have self-replicating things, you need to worry a bit about what might happen if they get out of control. So, let's assume we, evil scientists that we are, have managed to create a little self-replicating nanobot. This little guy can scurry around, running off something ubiquitous, probably some combination of solar, and some kind of infrared photovoltaics. This little guy, call him Bob, his only mission in life is to create a friend. He scurries around collecting the various ingredients necessary, and using his little robot arms, he slices and dices up the pieces and welds them together to create another copy of himself, Rob. Not satisfied with his work; Bob found Rob quite the bore, and honestly Rob didn't too much like Bob either, both of them part ways and try to fashion a new friend. How long until Bob and Rob and their cohorts manage to chew through all of the material on Earth? What we have here is the setup to a problem in Exponential Growth.

Exponential Growth

Let's simplify things a bit and assume that the nanobots always take a fixed amount to time to make a new copy of themselves, call that time T. We'll start with one guy, so we know that at t =0, we have 1 bot $$ N(t =0 ) = 1 $$ And we know that after T seconds we should have 2 $$ N(T) = 2 $$ and after 2T seconds, we've managed to double twice and get 4 $$ N(2T) = 4 $$ after 3T seconds we'll double again to 8, etc. In fact, after nT seconds, so m repetitions we should have doubled m times $$ N(nT) = 2^n $$ So if we want to describe all times, we need only ask how many doublings can fit into t seconds $$ t = n T $$ which gives us $$ N(t) = 2^{t/T} $$ At this point you might object, as this formula doesn't always give an integer, so we could ask things like how many bots are there after 0.5T seconds? We know the true answer is still 1, Bob hasn't finished Rob yet, but our formula tells us the answer is 1.414... What we've done is made a continuous approximation to a discrete function. Certainly, we've paid a price, in that our new formula doesn't get answers right in fractions of T, but its a small price to pay for the mathematical simplicity afforded by the nice continuous function, and as long as we don't really care about time scales smaller than T in the long run, we haven't done any real harm. These kinds of approximations show up all over the place in physics, and going both ways too. Sometimes it is advantageous to treat some discrete quantity as continuous, and sometimes it might be beneficial to treat some continuous quantity as discrete. These kinds of approximations are more than adequate, provided you don't really take the answers they give you in the cases where your approximation starts to break too seriously. In this case, as long as we don't try to seriously predict the number of nanobots to an exact count in time scales less than a fraction of their doubling time, we will have a nice prediction of the number of bots running around.

Earth Destruction

As promised, we wanted to calculate the time it would take the nanobots to devour the earth. For this we need a little bit more to our model. How will the nanobots eat the earth, I reckon it will be through using up its mass. Assuming the bots are made out of elements that are rich enough, something like iron, they ought to have a field day on Earth, seeing as it's composed of about 5% iron on the surface, and with an interior that is probably about 32% iron overall [ref]. So, we need to estimate the mass of a single nanobot. Let's say the nanobot is roughly a 1 micron sized cube, made out of iron. This gives us a nanobot mass of $$ m = (\text{ density of iron }) * (\text{ 1 micron} )^3 = \rho_{\text{Fe}} L^3 \sim 8 \text{ picograms} $$ From here we can estimate the time it would take to chew through the earth, as the time for the nanobots to be as massive as the earth. $$ \frac{M_{\oplus}}{\rho_{\text{Fe}} L^3 } = N(t) = 2^{t/T} $$ Solving for t we obtain $$ t = T \log_2 \frac{ M_{\oplus}}{ \rho_{\text{Fe}} L^3 } $$

Solution

Let's say it takes Bob one month to make Rob, which I don't think is a completely unrealistic time for nanobot replication, assuming Bob and Rob and all of their cohorts are 1 micron in size, I calculate that in 10 years time they would chew through the Earth. The power of exponential growth! Even with a 1 month gestation, if left unabashed, the self-replicating robots would eat the entire earth in 10 years time. They could eat through Mars in about 2. In fact in Postsingular this is what the humans planned. They wanted a Dyson sphere, so they sent some self-replicating robots to Mars, let them chew through it a couple years, and they had 10^37 little robots to do their bidding. That is of course until the nants set their sites on Earth as their next target... In order to let you play around with the doubling time and bot size, I've created a Wolfram Alpha widget that solves the above equation, feel free to play around with the parameters and see how long Earth would survive.

The widget should be right above this text. If it isn't working for some reason, here's a link

Earth Day Special: Post-Apocalyptic Literature

image At some point in elementary school I got into the habit of reading Franz Kafka's The Metamorphosis every time that I got sick. I found it strangely comforting to be reminded that while I might have scarlet fever and be intermittently hallucinating about Mickey Mouse, at least I had not been (spoiler alert!) turned into a giant cockroach and disowned by my family. Today is Earth Day! The earth has seen better days, and I got too depressed googling various environmental problems to even come up with a suitable list of examples. However, look on the bright side: things could be much, much worse. To explore how much worse it could be, here's a few of my favorite works of post-apocalyptic fiction - perfect reading for Earth Day. Skip past the cut to check them out. In no particular order, here's some of my favorite post-apocalyptic fiction. Many of these are aimed more toward young adults, and since this is a science blog, I've also tried to score them arbitrarily on their scientific plausibility (0-10). Check out the associated amazon pages for better descriptions and reviews.

  • Z for Zachariah
    • Robert C. O'Brien - Where's the best place to be when a nuclear war goes down? In a isolated valley in upstate New York, apparently! Z for Zachariah follows a 16 year old girl who is left to fend for herself after the bombs go off, until a Cornell chemistry postdoc shows up in a radiation suit. 7/10
  • The Postman
    • David Brin - Another in the post-nuclear war sub-genre. The story gets bogged down in weird survivalist themes in the second half, but paints a rather believable portrait of the aftermath of a nuclear winter. 5/10
  • A Canticle for Liebowitz
    • Walter Miller - Have you ever been stuck in a waiting room at the dentist's and the only thing to read is a Reader's Digest from 1983? In the future, it's like that, only way worse. 6/10
  • Childhood's End
    • Aurthur C. Clark - Sometimes the end of the world is surprisingly zen. 3/10
  • A Gift Upon the Shore
    • M. K. Wren - Rural Oregon also turns out to be a decent place to ride out a nuclear winter. Everything is great, unless your only surviving neighbors are fundamentalists. 7/10
  • Emergence
    • David R. Palmer - This is probably my favorite work in this genre. Emergence is the diary of a very plucky Candidia Smith-Foster, who, along with a pet parrot, has survived a communist bio attack. Things get a bit nutty in the end, but overall a very enjoyable read. Despite great reviews it's currently out of print, although a movie may be in the works. 8/10
  • I am Legend
    • It turns out that Will Smith was actually playing an older white dude. Who knew? It shares strange religious overtones with the movie, but much better written and with a totally different ending. 4/10
  • The Pesthouse
    • Jim Crace - Society has gone a long way backwards, but they hear everything is better in Europe. 5/10
  • The Road
    • Cormac McCarthy - I can't say I'm a huge fan of his writing style, but the world that Cormac McCarthy creates here is very compelling, although mind-numbingly depressing. 9/10

This is by no means an exhaustive list - there's a lot of classics that I haven't gotten around to reading yet such as On the Beach. I also have high hopes for Kim Stanley Robinson's The Wild Shore since I enjoyed his Mars series. Anyone else have anything to add? Happy Earth Day!

End of the Earth V: There Goes the Sun


image The Sun [photo courtesy of NASA]


People that know me well know that I have a lot in common with Robert Frost. We both were born in March and we both employ rural New England settings to explore complex social and philosophical themes in our poetry. We also like the same rap groups. In honor of my literary doppelganger, I will now, having already had the world end in fire, try my hand at ice. Let's try to answer the question: "If the sun blinks out of existence this instant, what is the temperature of the Earth as a function of time?" The Sun, in addition to being the King of Planets, is also what keeps us all warm and toasty and alive. What happens if we turn that off? Well, the Earth will cool by radiating its heat away into space. To see how long this would take, let's make some assumptions. Let's model the surface of the Earth as an ocean 1 km deep and let's pretend that all the heat is stored in this ocean. Let's take the ocean to be liquid water at T = 0 degrees Celsius. How long will it take this ocean to freeze into ice at 0 degrees Celsius? Well, the amount of energy released from the oceans as the water freezes is given by $$ Q = L_{w} M_{ocean} $$ where L is the "latent heat of fusion" and M is the mass of the water. The "latent heat of fusion" is a fancy way of saying "the amount of energy released per unit mass as water turns to ice at constant temperature." For water, we have that $$ L_{w} = 3.3 \times 10^5 \mbox{J/kg} $$ And for the mass of the ocean, it will be convenient later to write it as $$ M_{ocean} = 4\pi {R_{\oplus}}^2 \Delta R \rho $$ Alright, so now we've got enough to say how much heat energy we have, so how fast do we lose it? We can take the Earth to be a blackbody radiator, so the power lost in such a case is: $$ P =4\pi \sigma R_{\oplus}^2 T^4 $$ Since Power is just Energy per unit Time, we now have all we need to get the time for total freezing of all the oceans. We have: $$ t = \frac{Q}{P} = \frac{4\pi {R_{\oplus}}^2 \Delta R \rho L_{w}}{4\pi \sigma R_{\oplus}^2 T^4} $$ Simplifying the above expression a bit, we get $$ t =\frac{\Delta R \rho L_{w}}{\sigma T^4} $$ Now we can plug in some numbers, $$ t =\frac{\left(10^3 \mbox{ m}\right) \times \left(10^3 \frac{kg}{m^3}\right) \times \left(3.3 \times 10^5 \mbox{J/kg}\right)}{\left( 5.67 \times 10^{-8} J s^{-1} m^{-2} K^{-4}\right) \times \left( 273 K\right)^4} $$ where we have made sure to put our temperatures in Kelvin. Crunching the numbers with the calculator we "borrowed" from Nic three months ago gives: $$ t = 10^9 \mbox{ s} $$ Remembering that a year is very nearly $$ 1 \mbox{ year} = \pi \times 10^7 \mbox{ s}, $$ we find that the time for the oceans to freeze after the sun disappears is about 30 years. Hooray! Now this model was very simple. First of all, I assumed that the ocean temperatures were already at 0 degrees, but they are a bit warmer. If the oceans are about 300 K (ie 80 degrees in not-Yariv units), then we get another 30 years to cool down to freezing temperatures. Secondly, I have completely neglected the heat stored in the Earth. Will this change my answer by an embarrassingly large factor? Lastly, I have ignored all internal heating mechanisms (ie, radioactive decay) that will also heat up the Earth. But ignoring all that.... So is there a way for anyone to survive this? Well, for the most part it will mean the end of life on Earth. There could potentially be a few exceptions, like by geothermal vents and such. But for the most part, it's one quick cold spiral down to eternal nothingness. But what about a few people, could they survive for a bit even if the human race is doomed? I'm glad you asked! You see, I have this plan involving mine shafts. Hunkering down underground with a nuclear power plant and all the canned food food we can stomach should allow us to at least ride the rest of our lives. Details can be found here.

End of the Earth IV - Shocking Destruction

image Earth day is upon us once more. So many other namby-pamby bloggers out there (don't hurt me!) are writing about how wonderful the earth is and how great earth day is. We here at The Virtuosi take a more hardline approach. Today I'm going to tell you how to destroy the earth. Completely and totally. Unlike last year's methods, this one should work. In fact, this method is so simple that I can tell you what to do right now. Just tweak the charge on the electron so it is a bit out of balance with the charge on the proton. Just a little bit. How little a bit, you might ask? A very little bit. Really, this doesn't sound hard. I mean, sure, you have to do it for all of the electrons in the earth, but we're talking about a very very small percentage change. Not convinced? Let me show you just how small a change we're talking. If there is a charge imbalance in the electron and the proton, this will give the earth a net charge, throughout it's volume. I've got to make a few assumptions about the earth here, so hold on. I'm going to assume that the earth is a uniform density everywhere, and I'm going to assume that the earth is made entirely of iron. Now, the net charge of any iron atom will be $$ (q_e-q_p)Z=(q_e-q_p)26$$ where Z is the atomic number of iron, the number of protons (and electrons) the atom has. The net charge of the earth, Q, is the number of iron atoms, N, times this charge, $$Q=(q_e-q_p)ZN$$ I've previously estimated that N is about 310^50 atoms. Now, the electric potential energy of a sphere of radius r with charge q uniformly distributed throughout it's volume is $$U_e=\frac{3kq^2}{5r}$$ where k is the coulomb constant. Dissolution of the earth will occur when the electrostatic energy of the earth equals the gravitational potential energy of the earth. The gravitational bound energy of the earth is given by $$U_g=\frac{3GM^2}{5R}$$ Where M is the mass of the earth, G is Newton's gravitational constant, and R is the radius of the earth. Setting this equal to the electrostatic energy of the earth, $$\frac{3GM^2}{5R}=\frac{3kQ^2}{5R}$$ $$Q^2=\frac{G}{k}M^2$$ so $$(q_e-q_p)ZN=\left(\frac{G}{k}\right)^{1/2}M$$ Now, N is given, in our approximations, by $$N=\frac{M_{earth}}{m_{iron}}$$ so $$q_e-q_p=\left(\frac{G}{k}\right)^{1/2}\frac{m_{iron}}{Z_{iron}}$$ Now we can plug in some numbers. G=6.710^-11 m^3kg^-1s^-2, k= 910^9 m^3kgs^-2C^-2, m_iron=910^-26 kg, Z=26. Thus, $$q_e-q_p=310^{-37} C$$ To put this in perspective, the charge on the electron is 1.610^-19 C, so this is roughly 10^18 times less than that charge. Put another way, if the charge on the electron was imbalanced from that of the proton by roughly 1 part in 10^18, the earth would cease to exist due to electrostatic repulsion. As I told you at the beginning, you only have to change the charge by a very small amount! So get working. There are only about 1000000000000000000000000000000000000000000000000000 electrons you need to modify! *According to the internet, the density of the earth, on average, is roughly 5.5 g/cm^3. The density of iron is 7.9 g/cm^3 at room temperature, and the density of water is 1 g/cm^3 at room temperature. So, while the earth is not entirely iron (of course), it is a better approximation to assume the earth is iron than the earth is water. And those, of course, were really our only two choices. It turns out that this is a good argument for the charge balance of the electron and the proton.