The Wrath of Blotto
You may remember when I invited everyone to play my webform version of Colonel Blotto. Well, its still up and has been up for some time, but hasn't seen any action for a while so I thought it might be time to take a look at the results. Colonel Blotto is an interesting game. It seems to me, that much of this interest derives from the fact that how well your strategy performs is very much a function of which strategies exist in the pool. There is not a clear cut winning strategy, you need to feel out the existing pool and adapt accordingly. So to stir things up a little bit, in what follows I will share some data from the existing database, refraining myself from commenting too much. Basically, stay tuned for a bunch of pretty pictures which will hopefully get your gears turning. The game is still up, feel free to try to game it now that this information is out. Might be interesting to see what kind of effect releasing the leaderboard will have on the leaderboard.
Leader Board
347 Strategies were submitted since the game went live. Lets try and take a look at what kind of strategies were submitted. Below are the top 25 ranking strategies in the database as of yesterday, along with the actual strategy, its points, and full record.
Rank Name Strategy Wins Losses Ties Points 1 PygmyGrouse 2,3,4,5,19,22,7,20,12,6 210 74 61 481 2 eighth 4,4,19,19,4,19,4,4,19,4 209 74 62 480 3 tg1i6 3,4,5,11,19,18,17,18,4,1 190 58 97 477 4 centerfold3 2,2,17,17,20,20,17,1,2,2 178 55 112 468 5 goose 17,15,5,3,16,18,4,16,3,3 165 43 137 467 6 StrawMan2 2,3,4,5,19,22,7,22,11,5 202 81 62 466 7 blackbird 17,16,5,2,16,18,4,16,3,3 169 49 127 465 8 hawk 3,3,5,3,16,18,17,16,15,4 157 38 150 464 8 fairandbalanced 2,3,4,16,18,18,17,17,3,2 164 45 136 464 10 nightingale 17,14,5,4,16,18,4,16,3,3 173 55 117 463 10 finch 17,3,5,15,16,18,4,16,3,3 172 54 119 463 12 foxnews 1,3,3,17,18,18,18,17,3,2 159 44 142 460 12 D 15,16,17,18,19,1,2,3,4,5 154 39 152 460 14 notgonnawin16 2,2,2,19,19,20,16,16,2,2 185 71 89 459 15 bluebird 17,5,3,15,16,18,4,16,3,3 171 58 116 458 16 Poitiers 3,20,4,3,20,3,20,4,3,20 200 89 56 456 17 StrawMan1 2,3,3,3,22,22,7,20,12,6 196 86 63 455 17 tg1e16 4,16,4,14,2,17,2,17,5,19 150 40 155 455 19 Guadalcanal 18,2,2,18,18,2,18,18,2,2 146 37 162 454 20 centerfold2 2,1,17,18,20,20,18,1,1,2 156 48 141 453 20 Culloden 3,3,21,3,3,20,21,3,20,3 201 93 51 453 22 parrot 3,3,5,3,16,18,4,16,15,17 142 35 168 452 22 tg1f1 4,16,1,14,2,18,2,18,5,20 154 47 144 452 24 eagle 3,3,5,15,16,18,4,16,3,17 149 43 153 451 25 robin 17,16,5,15,16,18,4,3,3,3 160 57 128 448
Soldier Distribution
Next, lets try and take a look at all the strategies at once. Lets start with the soldier distributions among the different slots. I will remind you that the rules of the game are slot independent, i.e. if machines were trying to play this game against one another you would expect the soldier distribution to be more or less uniform between slots, any deviation from uniformity probably says something deep and profound about how humans think.
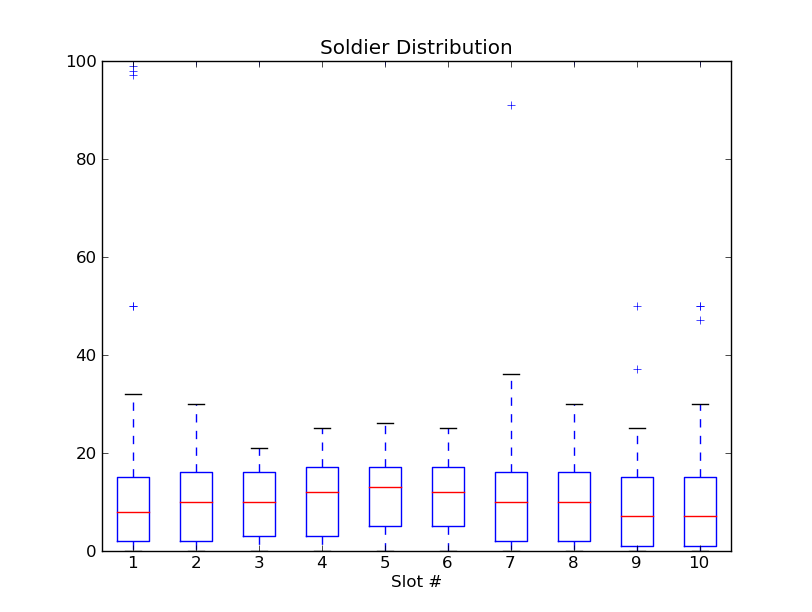
Above is a box and whiskers plot of all strategies, looking at the number of soldiers in each slot.

This plot is fun. It shows the full distribution of all of the strategies. I went through the database, and for every strategy, added one to the box that held true. I.e. for each slot (the slots are along the x axis), the y axis marks how many strategies in the database have that many soldiers in that slot. Should be fun to try and think about what the non-uniformities mean. Colorbar is on the side to make the colors quantitative.
Point Distribution
So, how well do all of the strategies do... lets take a look.
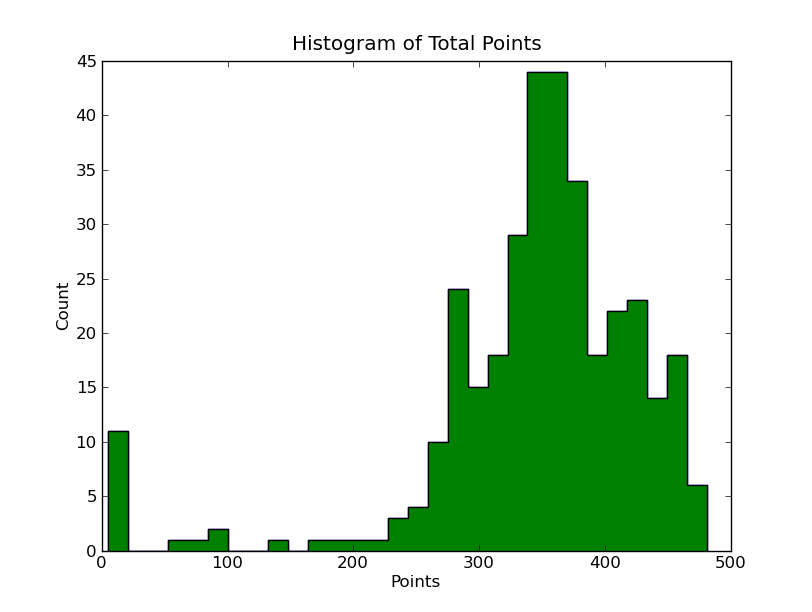
Above is a histogram of all the scores for all the strategies in the database. It has some interesting features. Definitely not singly peaked. What do you think is going on on the far left?
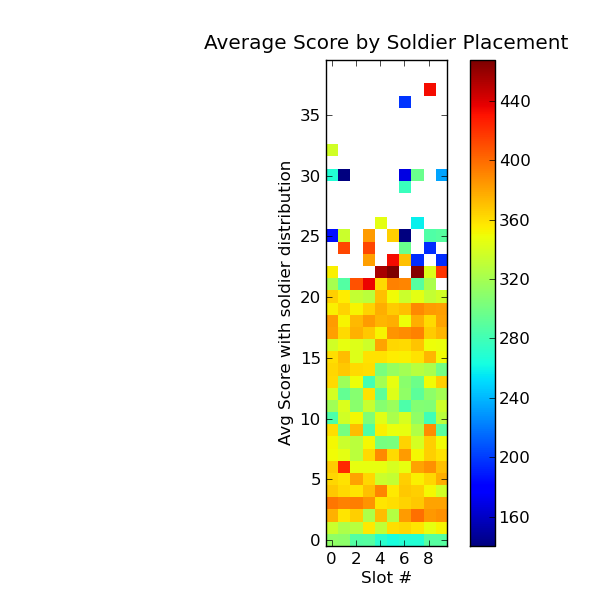
In this plot, I again went through all of the strategies in the database, and this time, every square reflects the average score for all strategies that have that many soldiers (y axis) in that slot (x axis).
Strategies Layout
Lets drill down a bit and look at how each strategy performs.
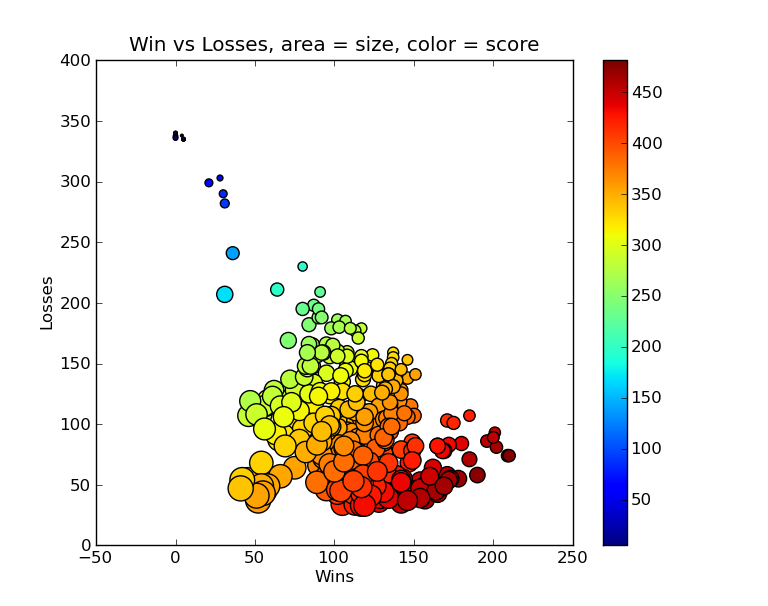
This scatter plot has a point for each strategy in the database, the x coordinate giving its number of wins, the y coordinate its number of losses. The area of the circle is scaled to its number of ties, and the color is scaled to its total score. Is there a clear trend? Why does it fan out?
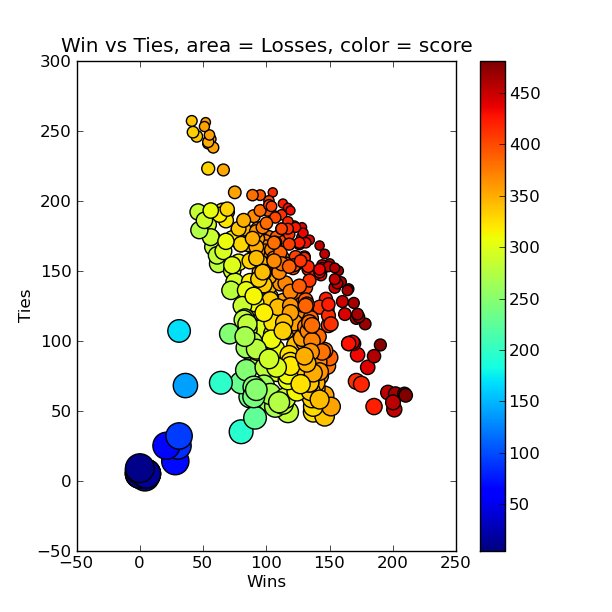
Similar plot as above but this time, x coordinate is Wins, Y is ties, size is losses and color score.

One more, this time x coordinate is losses, y is ties, color is score.
Fitness Landscapes
So, what should you do if you wanted to design a winning strategy? Lets first take a look at the fitness landscape. Now, this is difficult to do for the whole game, with 10 slots and something like 40 reasonable choices for each, this is some huge 10 dimensional space, which is difficult to visualize, so instead lets take a look at the fitness landscape for some lower dimensional cuts.

So in the above plot, what I've done is constructed a whole bunch of strategies. First I started with 8 soldiers in all slots but the ones listed in the title, namely slots 4,5,6 (starting with 1). So with only 3 slots free, and with the constraint that we have to have 100 soldiers total, I can parametrize a whole bunch of strategies with only two numbers, in this case the number of soldiers in slot 5 (x axis) and slot 6 (y axis). The color represents the score that the resulting strategy has when run against all of the previously existing strategies in the database. This was created without adding all of these strategies to the database itself as that would have changed the results.

Similar plot, this time changing the soldiers in slots 5,6 and 8 with x axis the number of soldiers in slot 6 and the y axis the number of soldiers in slot 8.

Another one, hopefully my labels make enough sense now that I don't have to spell it out. I think this one has an interesting shape. What's going on?

One more.
Random Strategies
So, lets say you are trying to construct winning strategies. The first thing you might try to do is construct random strategies, by randomly dropping 100 soldiers each into one of the slots at random. Doing so and running these strategies against the database I got an idea of how effective that would be.

Above is a histogram of the random strategies' scores. Not so good. Looks like humans playing the game are better than randomly guessing.
Best Strategy?
So lets say you wanted to make the best strategy, what could you look at? Well, for starters you might be interested in a question like the following? 'If I put N soldiers in slot X, what percentage of the existing strategies in the database would I beat in that slot?" The next graph answers this question.
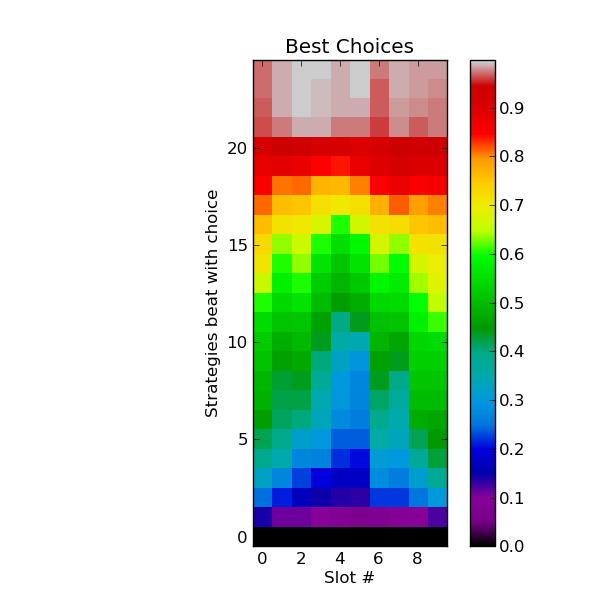
Here I have attempted to show for every X,Y coordinate the following. With Y soldiers in slot X, what percentage of the existing strategies do you beat in slot X. I changed the color scaling to make it more refined, so you can better read it quantitatively.
Go Forth
So, there you have it. You are not fueled with what is probably way more information than you were hoping for. Hopefully these graphs are more than just pretty, and get you thinking a bit. That is a lot of what science is about. Make some observations and then attempt to explain the results with your own models. You can then test your models with experiment. I've provided you with a bunch of observations and invited you to construct your own explinations. Now I invite you to perform an experiment. Think you know whats going on in the game? Then try and beat it. The link to play is the same as before.
Comments
Comments powered by Disqus