Benford's Law
Given a large set of data (bank accounts, river lengths, populations,
etc) what is the probability that the first non-zero digit is a one? My
first thought was that it would be 1/9. There are nine non-zero numbers
to choose from and they should be uniformly distributed, right? Turns
out that for almost all data sets naturally collected, this is not the
case. In most cases, one occurs as the first digit most frequently, then
two, then three, etc. That this seemingly paradoxical result should be
the case is the essence of Benford's Law. Benford's Law [1] states that
for most real-life lists of data, the first significant digit in the
data is distributed in a specific way, namely: $$ P(d) =
\mbox{log}{10}\left(1 + \frac{1}{d}\right) $$ The probabilities
for leading digits are roughly P(1) = 0.30, P(2) = 0.18, P(3) = 0.12,
P(4) = 0.10, P(5) = 0.08, P(6) = 0.07, P(7) = 0.06, P(8) = 0.05, P(9) =
0.04. So we would expect the first significant digit to be a one almost
30% of the time! But where would such a distribution come from? Well, it
turns out that it comes from a distribution that is logarithmically
uniform. We can map the interval [1,10) to the interval [0,1) by just
taking a logarithm (base ten). These logarithms are then distributed
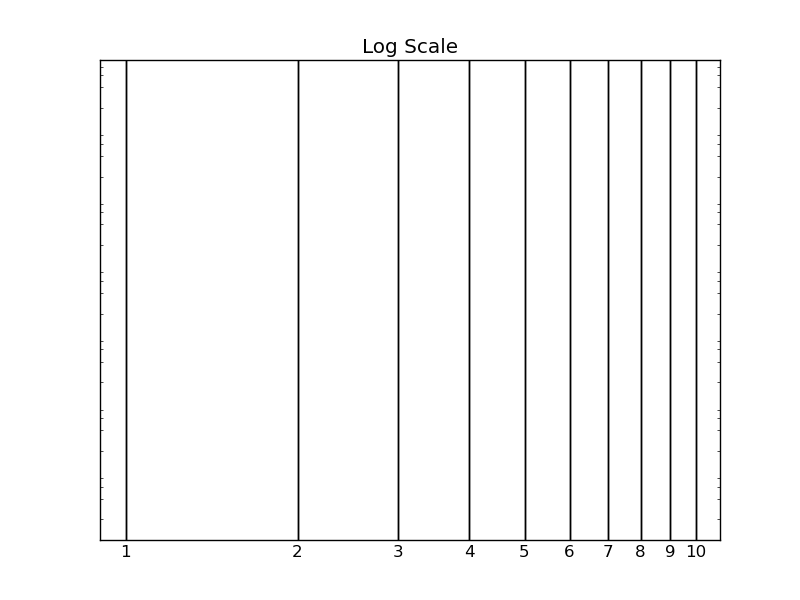
uniformly on the interval [0,1). We can now get some grasp for why one
should occur as the first digit more often in a uniform log
distribution. In the figure below, I have plotted 1-10 on a logarithm
scale. In a uniform log distribution, a given point is equally likely to
be found anywhere on the line. So the probability of getting any
particular first digit is just its length along that line. Clearly, the
intervals get smaller as the numbers get bigger.
 But we can quantify this, too. For a first digit on the interval [1,10),
the probability that the first digit is d is given by:
$$ P(d) = \frac{\mbox{log}(d+1)
-\mbox{log}{10}(d)}{\mbox{log}(10) -\mbox{log}{10}(1)} $$
which is just $$ P(d) =\mbox{log}(d+1) -\mbox{log}{10}(d) $$
or $$ P(d) = \mbox{log}\left( 1 + \frac{1}{d} \right) $$ which
is the distribution of Benford's Law. So how well do different data sets
follow Benford's Law? I decided to test it out on a couple easily
available data sets: pulsar periods, U.S. city populations, U.S. county
sizes and masses of plant genomes. Let's start first with pulsar
periods. I took 1875 pulsar periods from the ATNF Pulsar Database (found
here). The results
are plotted below. The bars represent the fraction of numbers that start
with a given digit and the red dots are the fractions predicted by
Benford's Law.
But we can quantify this, too. For a first digit on the interval [1,10),
the probability that the first digit is d is given by:
$$ P(d) = \frac{\mbox{log}(d+1)
-\mbox{log}{10}(d)}{\mbox{log}(10) -\mbox{log}{10}(1)} $$
which is just $$ P(d) =\mbox{log}(d+1) -\mbox{log}{10}(d) $$
or $$ P(d) = \mbox{log}\left( 1 + \frac{1}{d} \right) $$ which
is the distribution of Benford's Law. So how well do different data sets
follow Benford's Law? I decided to test it out on a couple easily
available data sets: pulsar periods, U.S. city populations, U.S. county
sizes and masses of plant genomes. Let's start first with pulsar
periods. I took 1875 pulsar periods from the ATNF Pulsar Database (found
here). The results
are plotted below. The bars represent the fraction of numbers that start
with a given digit and the red dots are the fractions predicted by
Benford's Law.
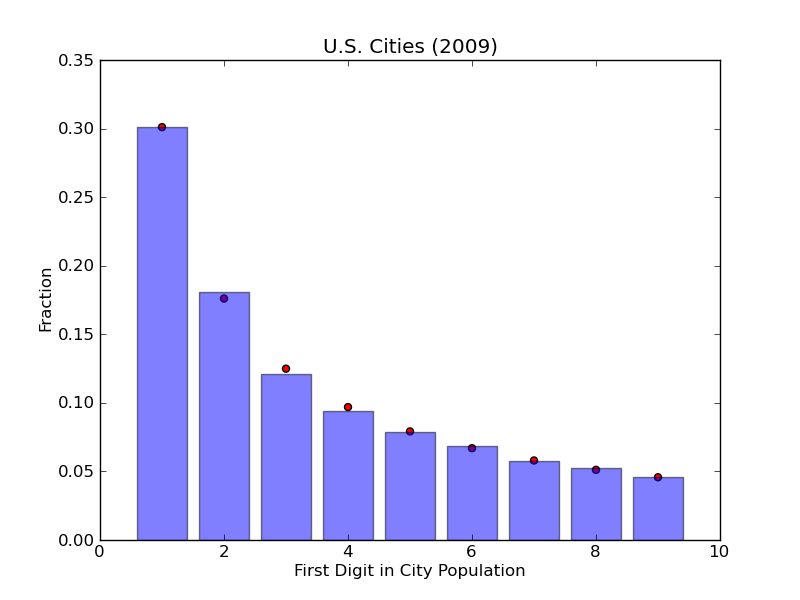
 From this plot, we see that the pulsar period data shows the general
trend of Benford's Law, but not exactly. Now let's try U.S. city
populations. This data was taken from the U.S. census bureau from the
2009 census and contains population data for over 81,000 U.S. cities. We
see from the chart below that there is a near exact correspondence
between the observed first-digit distribution and Benford's Law.
From this plot, we see that the pulsar period data shows the general
trend of Benford's Law, but not exactly. Now let's try U.S. city
populations. This data was taken from the U.S. census bureau from the
2009 census and contains population data for over 81,000 U.S. cities. We
see from the chart below that there is a near exact correspondence
between the observed first-digit distribution and Benford's Law.
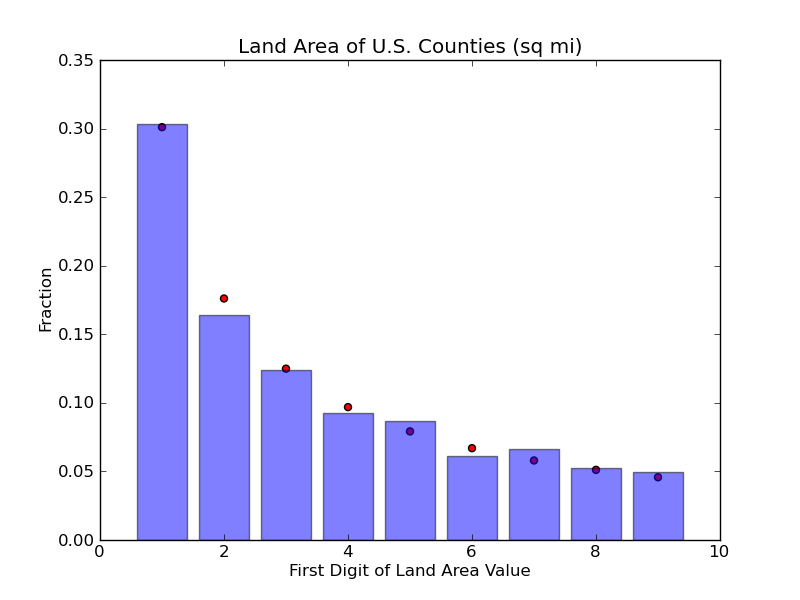
 Also from the U.S. census bureau, I got the data for the land area of
over 3000 U.S. counties. These data also conform fairly well to
Benford's Law.
Also from the U.S. census bureau, I got the data for the land area of
over 3000 U.S. counties. These data also conform fairly well to
Benford's Law.
 Finally, I found
this neat website
that catalogs the genome masses of over 2000 different species of
plants. I'm not totally sure why they do this, but it provided a ton
of easy-to-access data, so why not?
Finally, I found
this neat website
that catalogs the genome masses of over 2000 different species of
plants. I'm not totally sure why they do this, but it provided a ton
of easy-to-access data, so why not?
 Neat, so we see that wide variety of natural data follow Benford's Law
(some more examples
here). But why should
they? Well, as far as I have gathered, there are a few reasons for this.
The first two come from a paper published by Jeff Boyle [2]. Boyle makes
(and proves) two claims about this distribution. First, he claims that
"the log distribution [Benford's Law] is the limiting distribution when
random variables are repeatedly multiplied, divided, or raised to
integer powers." Second, he claims that once such a distribution is
achieved, it "persists under all further multiplications, divisions and
raising to integer powers." Since most data we accumulate (scientific,
financial, gambling,...) is the result of many mathematical operations,
we would expect that they would tend towards the logarithmic
distribution as described by Boyle. Another reason for why natural data
should fit Benford's Law is given by Roger Pinkham (in this
paper).
Pinkham proves that"the only distribution for the first significant
digits which is invariant under scale change of the underlying
distribution" is Benford's Law. This means that if we have some data,
say the lengths of rivers in feet, it will have some distribution in the
first digit. If we require that this distribution remain the same under
unit conversion (to meters, yards, cubits, ... ), the only distribution
that satisfies this distribution would be the uniform logarithmic
distribution of Benford's Law. This "scale-invariant" rationale for this
first digit law is probably the most important when it comes to data
that we actually measure. If we find some distribution for the first
digit, we would like it to be the same no matter what units we have
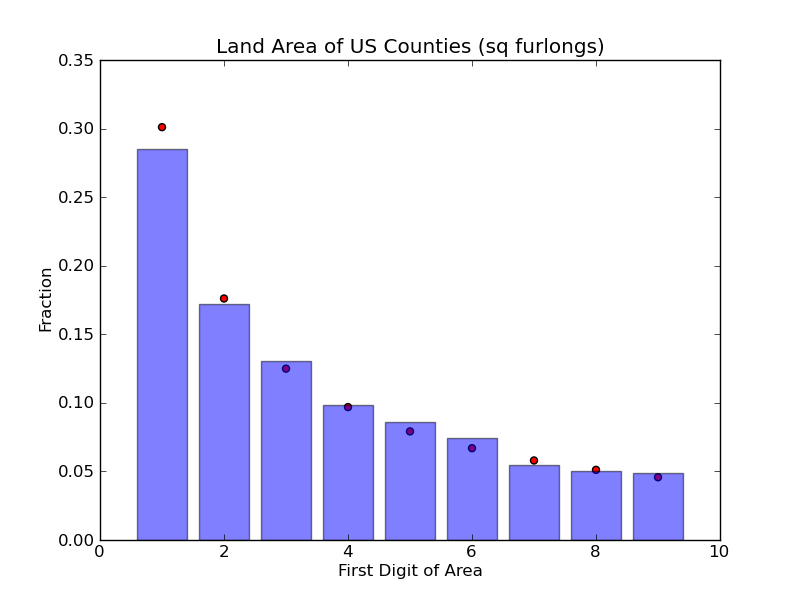
used. But this should also be really easy to test. The county size data
used above was given in square miles, so let's try some new units.
First, we can try square kilometers.
Neat, so we see that wide variety of natural data follow Benford's Law
(some more examples
here). But why should
they? Well, as far as I have gathered, there are a few reasons for this.
The first two come from a paper published by Jeff Boyle [2]. Boyle makes
(and proves) two claims about this distribution. First, he claims that
"the log distribution [Benford's Law] is the limiting distribution when
random variables are repeatedly multiplied, divided, or raised to
integer powers." Second, he claims that once such a distribution is
achieved, it "persists under all further multiplications, divisions and
raising to integer powers." Since most data we accumulate (scientific,
financial, gambling,...) is the result of many mathematical operations,
we would expect that they would tend towards the logarithmic
distribution as described by Boyle. Another reason for why natural data
should fit Benford's Law is given by Roger Pinkham (in this
paper).
Pinkham proves that"the only distribution for the first significant
digits which is invariant under scale change of the underlying
distribution" is Benford's Law. This means that if we have some data,
say the lengths of rivers in feet, it will have some distribution in the
first digit. If we require that this distribution remain the same under
unit conversion (to meters, yards, cubits, ... ), the only distribution
that satisfies this distribution would be the uniform logarithmic
distribution of Benford's Law. This "scale-invariant" rationale for this
first digit law is probably the most important when it comes to data
that we actually measure. If we find some distribution for the first
digit, we would like it to be the same no matter what units we have
used. But this should also be really easy to test. The county size data
used above was given in square miles, so let's try some new units.
First, we can try square kilometers.
 Slightly different than square miles, but still a very good fit. Now how
about square furlongs?
Slightly different than square miles, but still a very good fit. Now how
about square furlongs?
 Neat! Seems like the distribution holds true regardless of the units we
have used. So it seems like a wide range of data satisfy Benford's Law.
But is this useful in any way or is it just a statistical curiosity?
Well, it's mainly just a curiosity. But people have found some pretty
neat applications. One field in which it has found use is Forensic
Accounting, which I
can only assume is a totally rad bunch of accountants that dramatically
remove sunglasses as they go over tax returns. Since certain types of
financial data (for example, see
here)
should follow Benford's Law, inconsistencies in financial returns can be
found if the data is faked or manipulated in any way. Moral of the
story: If you're going to cook the books, remember Benford! [1]
Benford's Law, in the great tradition of Stigler's
Law, was
discovered by Simon Newcomb. [2] Paper can be found
here. Unfortunately, this is only a
preview as the full version isn't publicly available without a library
license. The two points that I use from this paper are at least stated
in this preview.
Neat! Seems like the distribution holds true regardless of the units we
have used. So it seems like a wide range of data satisfy Benford's Law.
But is this useful in any way or is it just a statistical curiosity?
Well, it's mainly just a curiosity. But people have found some pretty
neat applications. One field in which it has found use is Forensic
Accounting, which I
can only assume is a totally rad bunch of accountants that dramatically
remove sunglasses as they go over tax returns. Since certain types of
financial data (for example, see
here)
should follow Benford's Law, inconsistencies in financial returns can be
found if the data is faked or manipulated in any way. Moral of the
story: If you're going to cook the books, remember Benford! [1]
Benford's Law, in the great tradition of Stigler's
Law, was
discovered by Simon Newcomb. [2] Paper can be found
here. Unfortunately, this is only a
preview as the full version isn't publicly available without a library
license. The two points that I use from this paper are at least stated
in this preview.
Comments
Comments powered by Disqus