A Buffoon's Toothpicks
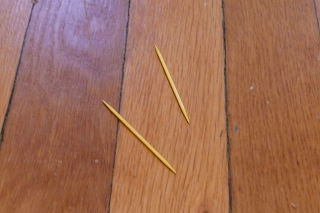
 Figure 1: Two of the thousands of toothpicks on my floor
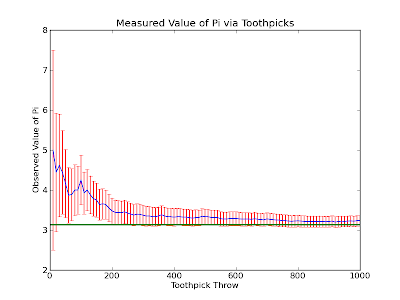
You're sitting at a bar, bored out of your mind. You've got an unlimited supply of pretzel rods and a lot of time to kill. The floor is made of thin wooden planks. How can you calculate pi? This is how the problem of Buffon's needle was first presented to me. Stated more formally the problem is this: given a needle of length l and a floor of parallel lines separated by a distance d, what is the probability of a randomly dropped needle crossing a line? Working this all out (see a derivation here, for example), we find that the probability a needle crosses a line is $$ P = \frac{2l}{d\pi} $$ So now we have a nice way of experimentally coming up with a value for pi. Simply by tossing a bunch of needles of length l on a striped surface with lines separated by a distance d and counting the total number of times a needle crosses a line and the total number of throws, we can approximate the probability (and thus, pi). I say "approximate" because it will only be true in the limit of an infinite number of throws. Anyway, we have that $$ \frac{\mbox{Number of crosses}}{\mbox{Number of throws}} \approx P = \frac{2l}{\pi d} $$ so, rearranging a bit, we have that $$ \pi \approx \left( \frac{2l}{d} \right) \left(\frac{\mbox{Number of throws}}{\mbox{Number of crosses}} \right) $$ Now we have something that we can go about measuring. I am going to define the following value to be the experimental quantity we aim to measure: $$ \tilde{\pi} = \left( \frac{2l}{d} \right) \left(\frac{\mbox{Number of throws}}{\mbox{Number of crosses}} \right) $$ So now that we know what we are measuring, let's get to it! Since I'm not allowed to use needles in my home experiments anymore, I decided to use toothpicks. For my striped surface, I just used the wooden floor in our house (see Figure 1). The toothpick length was almost exactly the same as the distance between lines on the floor, so we see that that the land d terms cancel in our expression above. To make the measurements, I threw ten toothpicks at a time onto the floor and counted how many crossed the lines. I chose ten because it seemed like a nice number. It was small enough that I shouldn't expect too much clumping of the toothpicks (and unwanted correlations in the data), but large enough that I didn't have to drop and pick up a single toothpick a thousand times. I threw the groups of ten toothpicks 100 times and tallied the results. Thus, I have 1000 throws of a single needle. It took the entirety the movie Undercover Brother to throw and pick up all those toothpicks, but when all was said and done I found that out of 1000 thrown toothpicks, 618 crossed the line. Plugging this back into our equation above (and remembering l = d), we get $$ \tilde{\pi}=\left(\frac{2l}{d}\right) \left(\frac{\mbox{Number of throws}}{\mbox{Number of crosses}} \right)=2 \left(\frac{1000}{618}\right)=3.23$$ Well that's not too far off I guess. But it's certainly not the pi that I know and love. What went wrong? As I mentioned before, since I am only doing a finite number of runs here I am not finding the exact probability. So is there anyway to gauge our uncertainty? Sure. Since we are doing a counting experiment with a lot of events, we can approximate our error using Poisson statistics. For a Poisson distribution, the standard deviation is just the square root of the number of events (in this case, crosses). So we have that our total number of crosses is $$ \mbox{Number of crosses} = 618 \pm \sqrt{618} = 618 \pm 24.9 $$ So now if we want to find the uncertainty in our final measurement, we'll have to propagate the error through. This gives us a final value of $$ \tilde{\pi} = 3.23 \pm 0.13 $$ and we see that the exact value of pi falls within there. We can see that this value gets better and better if we plot our value of pi as a function of the number of throws. Figure 2 shows the measured value of pi (with error bars) over a wide range of throw numbers. The actual value of pi is plotted as a green line.
 Figure 2: Measured pi value in blue, actual in green, click for bigger version
So we see that the more toothpicks we drop, the closer and closer we get to pi. Hot dog! Certainly an evening well spent.
Comments
Comments powered by Disqus