Ringing A Bridge
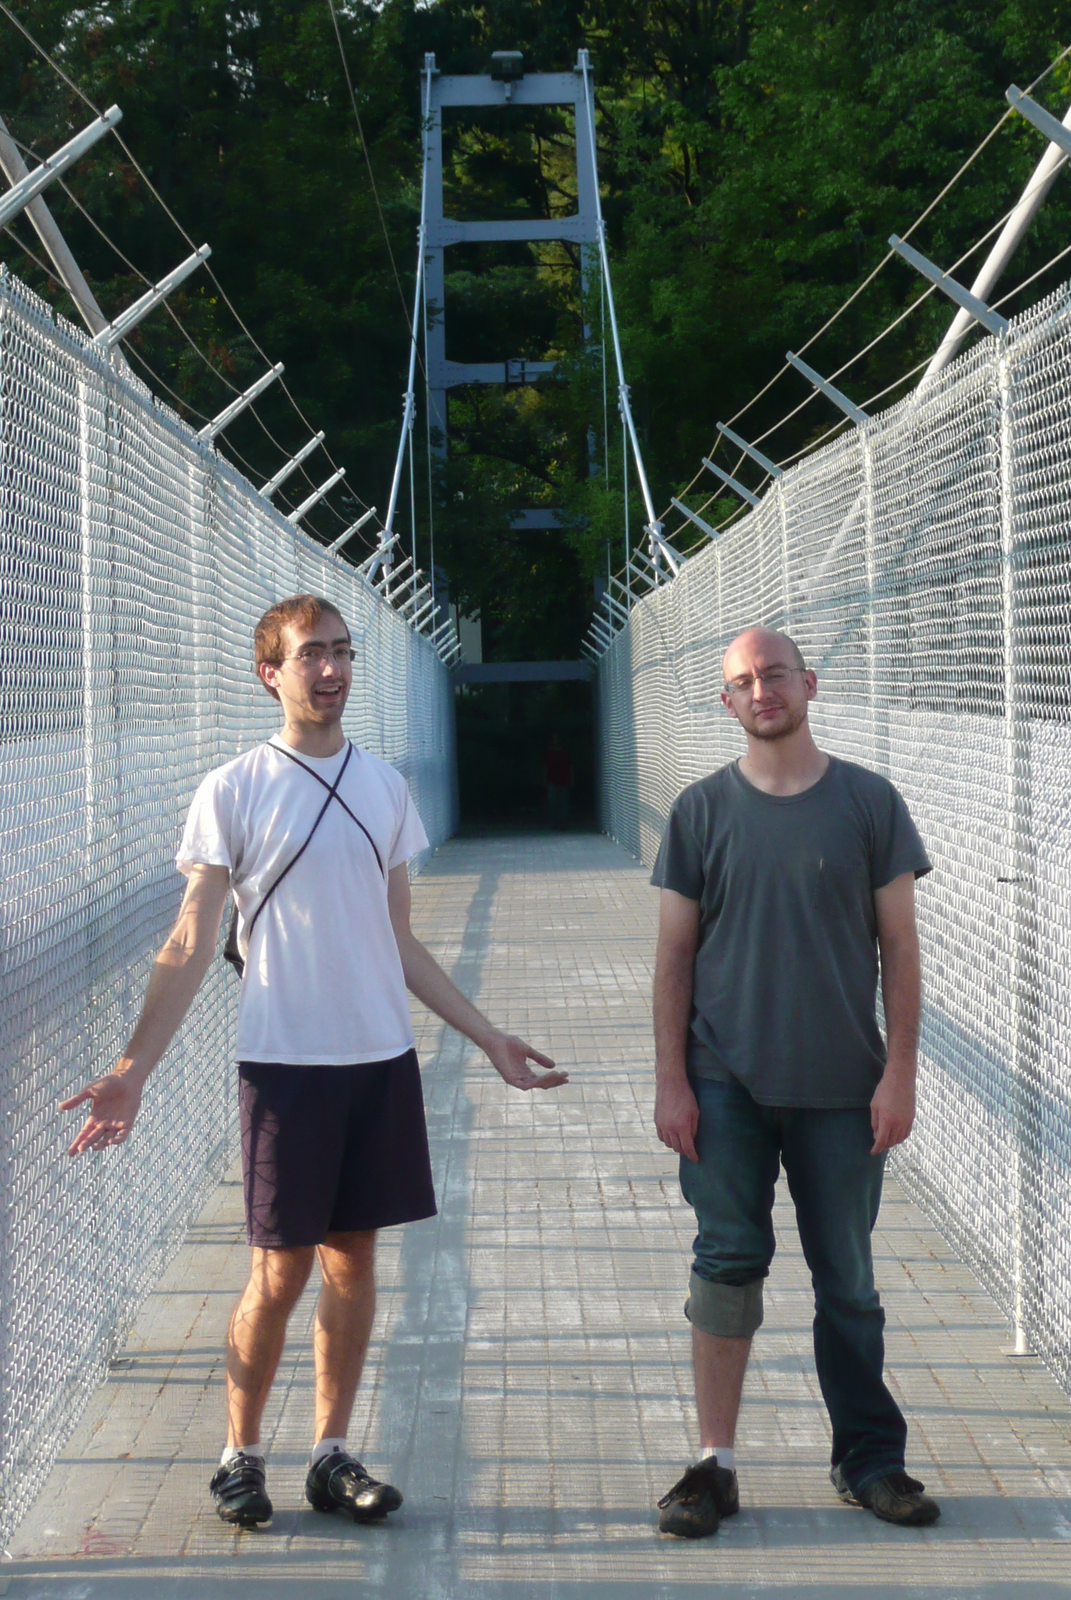 Matt and Jared standing on our experiment
When you strike a bell, it rings at a given frequency. This frequency is
called the resonant frequency and is the natural frequency at which the
bell likes to ring. Just about anything that can shake, rattle, or
oscillate will have a resonant frequency. Things like quartz crystals,
wine glasses, and suspension bridges all have a resonant frequency. The
quartz crystals oscillate at frequencies high enough for accurate
timekeeping in watches, the wine glasses at audible frequencies to make
boring dinners more interesting, and bridges at low enough frequencies
that you can feel it when you walk. It is the resonant frequency of
bridges that we decided to measure.
To make our measurements, we "borrowed" Yariv's fancy phone. One of the
nice things about fancy new phones is that most of them have internal
accelerometers to detect motion. You can do a whole bunch of fun
experiments and take some pretty good data with these accelerometers
(see, for example, physicist and TV star Rhett Allain's posts over at
dot physics). Placing
Yariv's phone on the suspension footbridge on campus, Alemi, Matt and I
took data and confused passers-by for about 15 minutes. The
accelerometer in the phone measures acceleration in three coordinate
directions: x is along the width of the bridge, y is along the length of
the bridge, and z is up and down. The raw data is shown below. The z
data is shown in blue, and x and y in green and red.
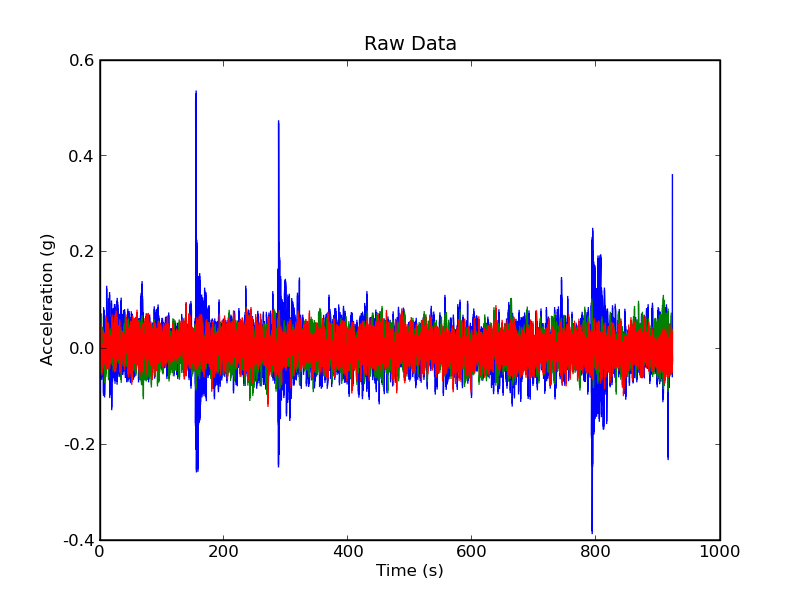 The first thing you'll notice about this data is that the z direction
(blue) has big spikes in it around 180s, 300s, and 800s. The biggest
spikes are when Alemi and I jumped up and down to ring the bridge. The
smaller bumps in the blue data are the result of people walking or
jogging by.
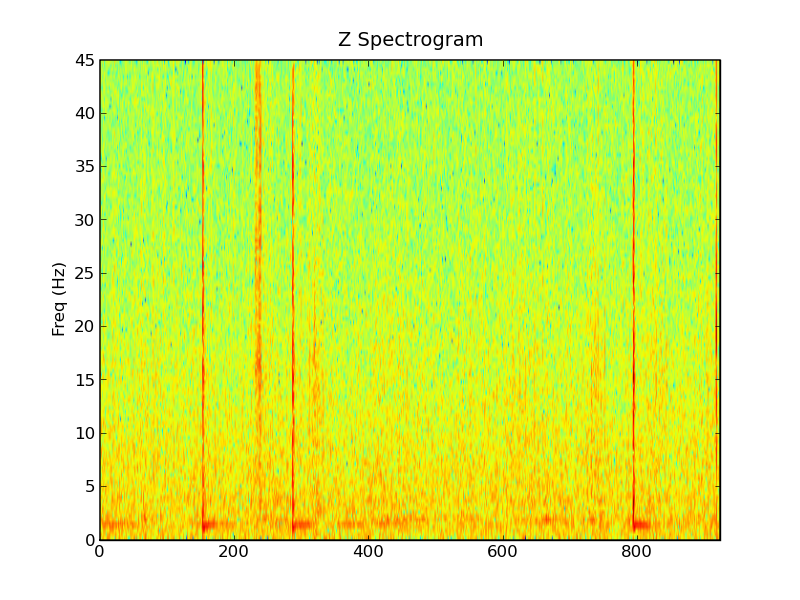
With the raw acceleration data and knowledge of the sample rate of the
accelerometer ( 90 Hz ), we can Fourier transform it to get frequencies.
Doing this to the raw data for each dimension we get the following
spectrograms. Each of the spectrograms illustrates how much of each
frequency is present at each point in time.
The most relevant direction for us is the z direction. We see that at
several points there are strong signals at all frequencies followed by
longer periods where the main signal is around 1 Hz. These events
correspond to when Alemi and I jumped up and down and are analogous to
ringing a bell. The striking of the bell is just a sharp impulse
(roughly a delta function) which is composed of all frequencies. Soon
after the impulse, all of the frequencies die out except for the
resonant frequency, which keeps on ringing. Just looking at this graph,
it looks like the bridge resonant frequency is around 1 Hz.
The first thing you'll notice about this data is that the z direction
(blue) has big spikes in it around 180s, 300s, and 800s. The biggest
spikes are when Alemi and I jumped up and down to ring the bridge. The
smaller bumps in the blue data are the result of people walking or
jogging by.
With the raw acceleration data and knowledge of the sample rate of the
accelerometer ( 90 Hz ), we can Fourier transform it to get frequencies.
Doing this to the raw data for each dimension we get the following
spectrograms. Each of the spectrograms illustrates how much of each
frequency is present at each point in time.
The most relevant direction for us is the z direction. We see that at
several points there are strong signals at all frequencies followed by
longer periods where the main signal is around 1 Hz. These events
correspond to when Alemi and I jumped up and down and are analogous to
ringing a bell. The striking of the bell is just a sharp impulse
(roughly a delta function) which is composed of all frequencies. Soon
after the impulse, all of the frequencies die out except for the
resonant frequency, which keeps on ringing. Just looking at this graph,
it looks like the bridge resonant frequency is around 1 Hz.
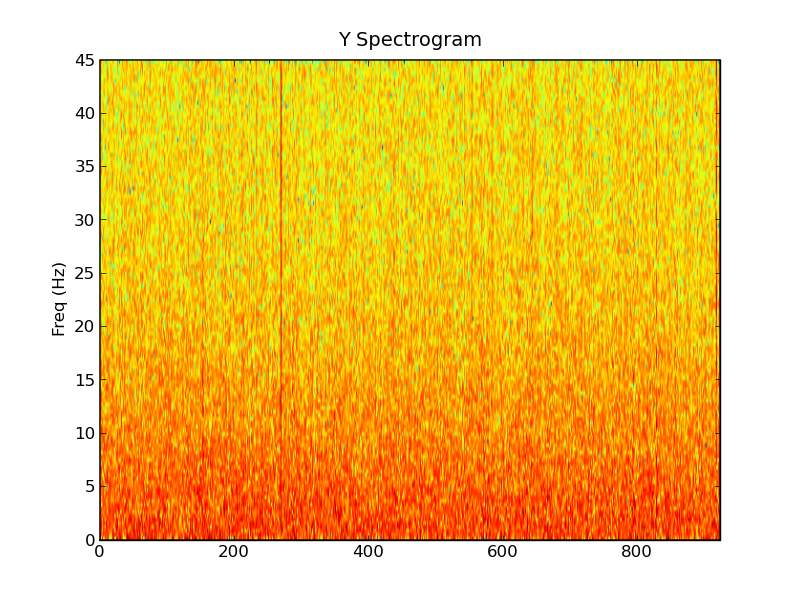
 We can also make similar graphs for the x and y directions. Remember,
the x direction is the width of the bridge and the y direction is the
length of the bridge. Although there is less motion in these directions,
the spikes where we jumped and people walked by are still clearly
visible.
We can also make similar graphs for the x and y directions. Remember,
the x direction is the width of the bridge and the y direction is the
length of the bridge. Although there is less motion in these directions,
the spikes where we jumped and people walked by are still clearly
visible.

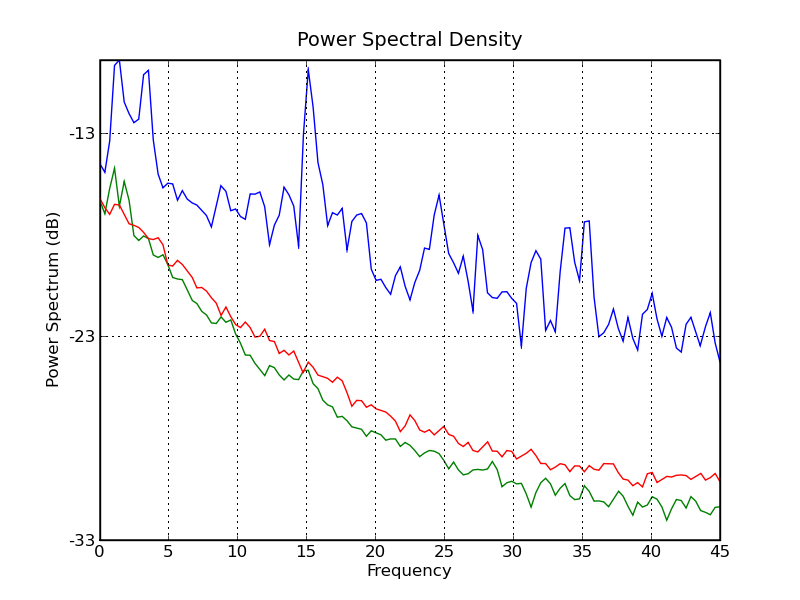
 Finally, we can find out how much of a particular frequency is in the
whole signal. To do this we take find the power spectrum density of the
entire data set (blue is z, green is x and red is y). The ringdown
frequency of about 1 Hz we saw in the spectrograms above after the jumps
is illustrated in this graph as the first blue peak. There are also some
other peaks at around 15 Hz, 25 Hz and 35 Hz. I am not sure what they
correspond to.
Finally, we can find out how much of a particular frequency is in the
whole signal. To do this we take find the power spectrum density of the
entire data set (blue is z, green is x and red is y). The ringdown
frequency of about 1 Hz we saw in the spectrograms above after the jumps
is illustrated in this graph as the first blue peak. There are also some
other peaks at around 15 Hz, 25 Hz and 35 Hz. I am not sure what they
correspond to.
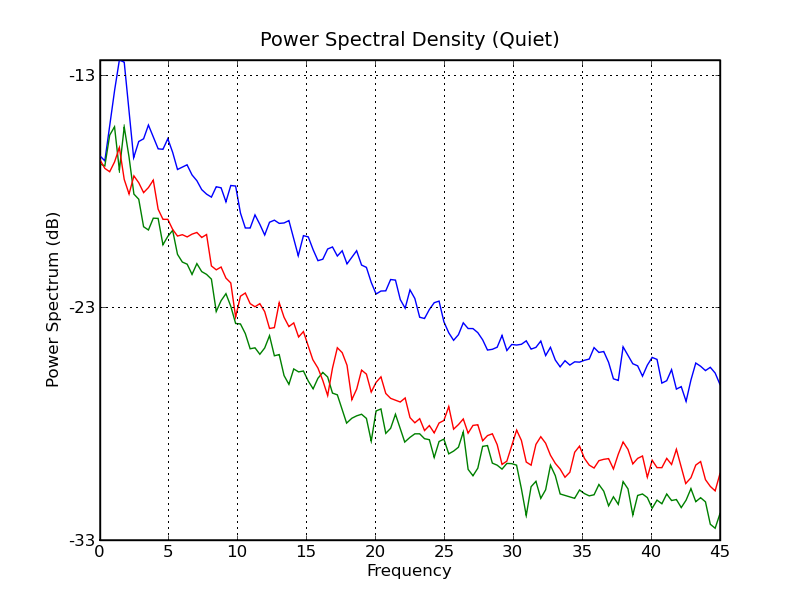
 To clean up this a bit, we can just take the data without the jumps in
it. Computing a new power spectrum density with just the data from about
400s - 700s, we get the following graph, which also displays a fairly
prominent peak around 1 Hz.
To clean up this a bit, we can just take the data without the jumps in
it. Computing a new power spectrum density with just the data from about
400s - 700s, we get the following graph, which also displays a fairly
prominent peak around 1 Hz.
 So it seems that there is definitely something going on around 1 Hz.
Initially, I was worried that this is just the rate at which people walk
and therefore it was just showing up because we had people walking the
whole time. However, the strong 1 Hz signal after each ringing in each z
spectrogram seems to indicate that it is intrinsic to the bridge.
Therefore, it seems as though the resonant frequency in the z direction
of the bridge is about 1 Hz. But don't take our word for it. If you want
to do your own analysis, you can find the raw data
here.
So it seems that there is definitely something going on around 1 Hz.
Initially, I was worried that this is just the rate at which people walk
and therefore it was just showing up because we had people walking the
whole time. However, the strong 1 Hz signal after each ringing in each z
spectrogram seems to indicate that it is intrinsic to the bridge.
Therefore, it seems as though the resonant frequency in the z direction
of the bridge is about 1 Hz. But don't take our word for it. If you want
to do your own analysis, you can find the raw data
here.
Comments
Comments powered by Disqus